
A new set of the Firefox Developer Tools features has just been uplifted to the Aurora channel. These features are available right now in Aurora, and will be in the Firefox 31 release in July. This release brings new tools, editor improvements, console and inspector features:
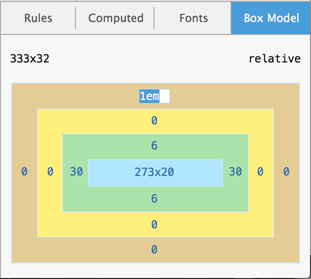
Editable box model
The Box Model tab in the Inspector is now editable for easy experimentation. Double-click any of the margin, border, or padding values to change its value for the currently selected element. Enter any valid CSS <length> value and use the Up/Down keys to increment or decrement the value by 1. Alt-Up increments by 0.1 and Shift-Up increments by 10. (development notes)
Eyedropper
New to the color picker in the Inspector is an Eyedropper tool that grabs the color from any pixel on the page. Select the current color by clicking or pressing Enter. Abort the operation by pressing Esc. Use the Up/Down keys to move by one pixel, and Shift-Up/Shift-Down to move by 10 pixels.
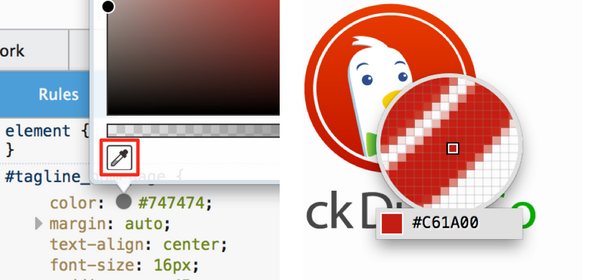
You can also use the eyedropper directly to copy a color to the clipboard by accessing it from Web Developer menu, or the toolbar icon that’s enabled by going to the settings panel and checking Available Toolbox Buttons > Grab a color from the page. (development notes)
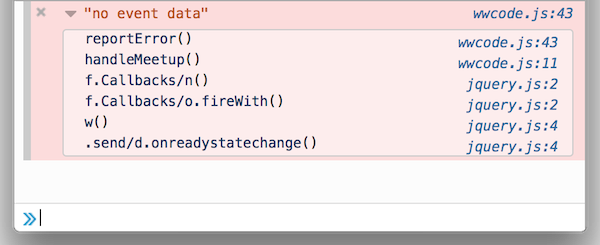
Console stack traces
console.error, console.exception, and console.assert logs in the console now include the full stack from where the call was made. (development notes)
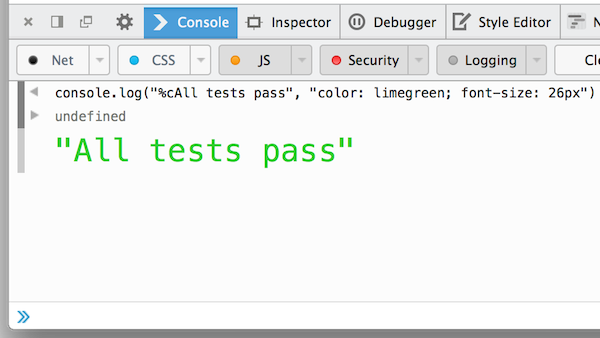
Styled console logs
On parity with other browser developer tools, you can now add style to console logging with the %c directive.
(development notes)
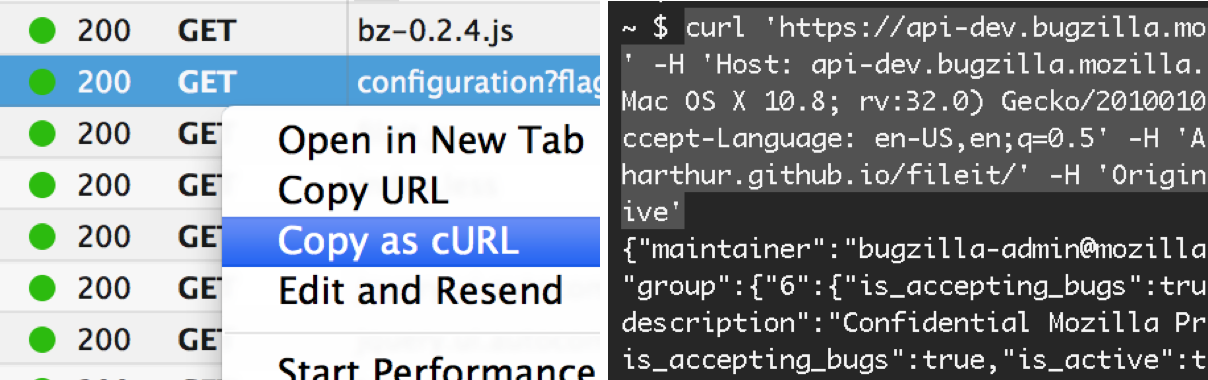
Copy as cURL
Replay any network request in the Network Monitor from the comfort of your own terminal. Right-click a request and select the copy as cURL menu item to copy a cURL command to the clipboard, including arguments for headers and data. (development notes)
Editor – multiple selection, Sublime Text keys
The source editor used in the developer tools has been upgraded to CodeMirror 4. With that brings:
Ctrl/Cmd while selecting to get multiple selections.Alt to select a column-aligned block of text.Ctrl-U/Cmd-U and redo with Alt-U/Shift-Cmd-U.about:config in the url bar and set devtools.editor.keymap to sublime.Multiple selection in action:
Canvas Debugger
Debug animation frames in WebGL and 2d canvas contexts with the newly-landed canvas debugger. The canvas debugger is an experimental feature that has to be enabled in the setting panel. Multiple canvases are not yet supported (bug) as well as animations generated with setInterval (bug). The canvas debugger is described in more in this blog post.
(development notes)
Add-on Debugger
If you develop Firefox add-ons using the Add-on SDK, there’s now a much easier way to debug your add-on’s JavaScript modules. See the blog post for more details. (development notes)
Firefox 31: Add-on Debugger from Jordan Santell on Vimeo.
Other features
- Expand descendants. Hold
Altwhile double-clicking a node in the Inspector to expand all of its children and descendants. (development notes) - Persist network logs. Check
Enable persistent logsin the settings panel to keep Network panel logs across reloads and navigations. (development notes) - JS warnings on by default. JavaScript warnings now show up in the Console by default. (development notes)
- Scratchpad View menu. The Scratchpad tool now has a View menu with options for changing font size, hiding line numbers, wrapping text, and highlighting trailing spaces. (development notes)
Special thanks to the 38 contributors that added all the features and fixes in this release.
Questions or suggestions? Comment here or shoot feedback to @FirefoxDevTools on Twitter or our brand new feedback channel for Firefox Developer Tools. If you’d like to help out, check out the guide to getting involved.
About Heather Arthur
Firefox developer tools developer at Mozilla, working mainly on the style tools.
More articles by Heather Arthur…
About Robert Nyman [Editor emeritus]
Technical Evangelist & Editor of Mozilla Hacks. Gives talks & blogs about HTML5, JavaScript & the Open Web. Robert is a strong believer in HTML5 and the Open Web and has been working since 1999 with Front End development for the web - in Sweden and in New York City. He regularly also blogs at http://robertnyman.com and loves to travel and meet people.
43 comments