Faster smarter JavaScript debugging in Firefox DevTools

Script debugging is one of the most powerful and complex productivity features in the web developer toolbox. Done right, it empowers developers to fix bugs quickly and efficiently. So the question for us, the Firefox DevTools team, has been, are the Firefox DevTools doing it right?

We’ve been listening to feedback from our community. Above everything we heard the need for greater reliability and performance; especially with modern web apps. Moreover, script debugging is a hard-to-learn skill that should work in similar fashion across browsers, but isn’t consistent because of feature and UI gaps.

With these pain points in mind, the DevTools Debugger team – with help from our tireless developer community – landed countless updates to design a more productive debugging experience. The work is ongoing, but Firefox 67 marks an important milestone, and we wanted to highlight some of the fantastic improvements and features. We invite you to open up Firefox Quantum: Developer Edition, try out the debugger on the examples below and your projects and let us know if you notice the difference.

A rock-solid debugging experience

Fast and reliable debugging is the result of many smaller interactions. From initial loading and source mapping to breakpoints, console logging, and variable previews, everything needs to feel solid and responsive. The debugger should be consistent, predictable, and capable of understanding common tools like webpack, Babel, and TypeScript.

We can proudly say that all of those areas have improved in the past months:

  1. Faster load time. We’ve eliminated the worst performance cliffs that made the debugger slow to open. This has resulted in a 30% speedup in our performance test suite. We’ll share more of our performance adventures in a future post.
  2. Excellent source map support. A revamped and faster source-map backend perfects the illusion that you’re debugging your code, not the compiled output from Babel, Webpack, TypeScript, vue.js, etc.
    Generating correct source maps can be challenging, so we also contributed patches to build tools (i.e. babel, vue.js, regenerator) – benefiting the whole ecosystem.
  3. Reduced overhead when debugger isn’t focused. No need to worry any longer about keeping the DevTools open! We found and removed many expensive calculations from running in the debugger when it’s in the background.
  4. Predictable breakpoints, pausing, and stepping. We fixed many long-standing bugs deep in the debugger architecture, solving some of the most common and frustrating issues related to lost breakpoints, pausing in the wrong script, or stepping through pretty-printed code.
  5. Faster variable preview. Thanks to our faster source-map support (and lots of additional work), previews are now displayed much more quickly when you hover your mouse over a variable while execution is paused.

These are just a handful of highlights. We’ve also resolved countless bugs and polish issues.

Looking ahead

Foremost, we must maintain a high standard of quality, which we’ll accomplish by explicitly setting aside time for polish in our planning. Guided by user feedback, we intend to use this time to improve new and existing features alike.

Second, continued investment in our performance and correctness tests ensures that the ever-changing JavaScript ecosystem, including a wide variety of frameworks and compiled languages, is well supported by our tools.

Debug all the things with new features

Finding and pausing in just the right location can be key to understanding a bug. This should feel effortless, so we’ve scrutinized our own tools—and studied others—to give you the best possible experience.

Inline breakpoints for fine-grained pausing and stepping

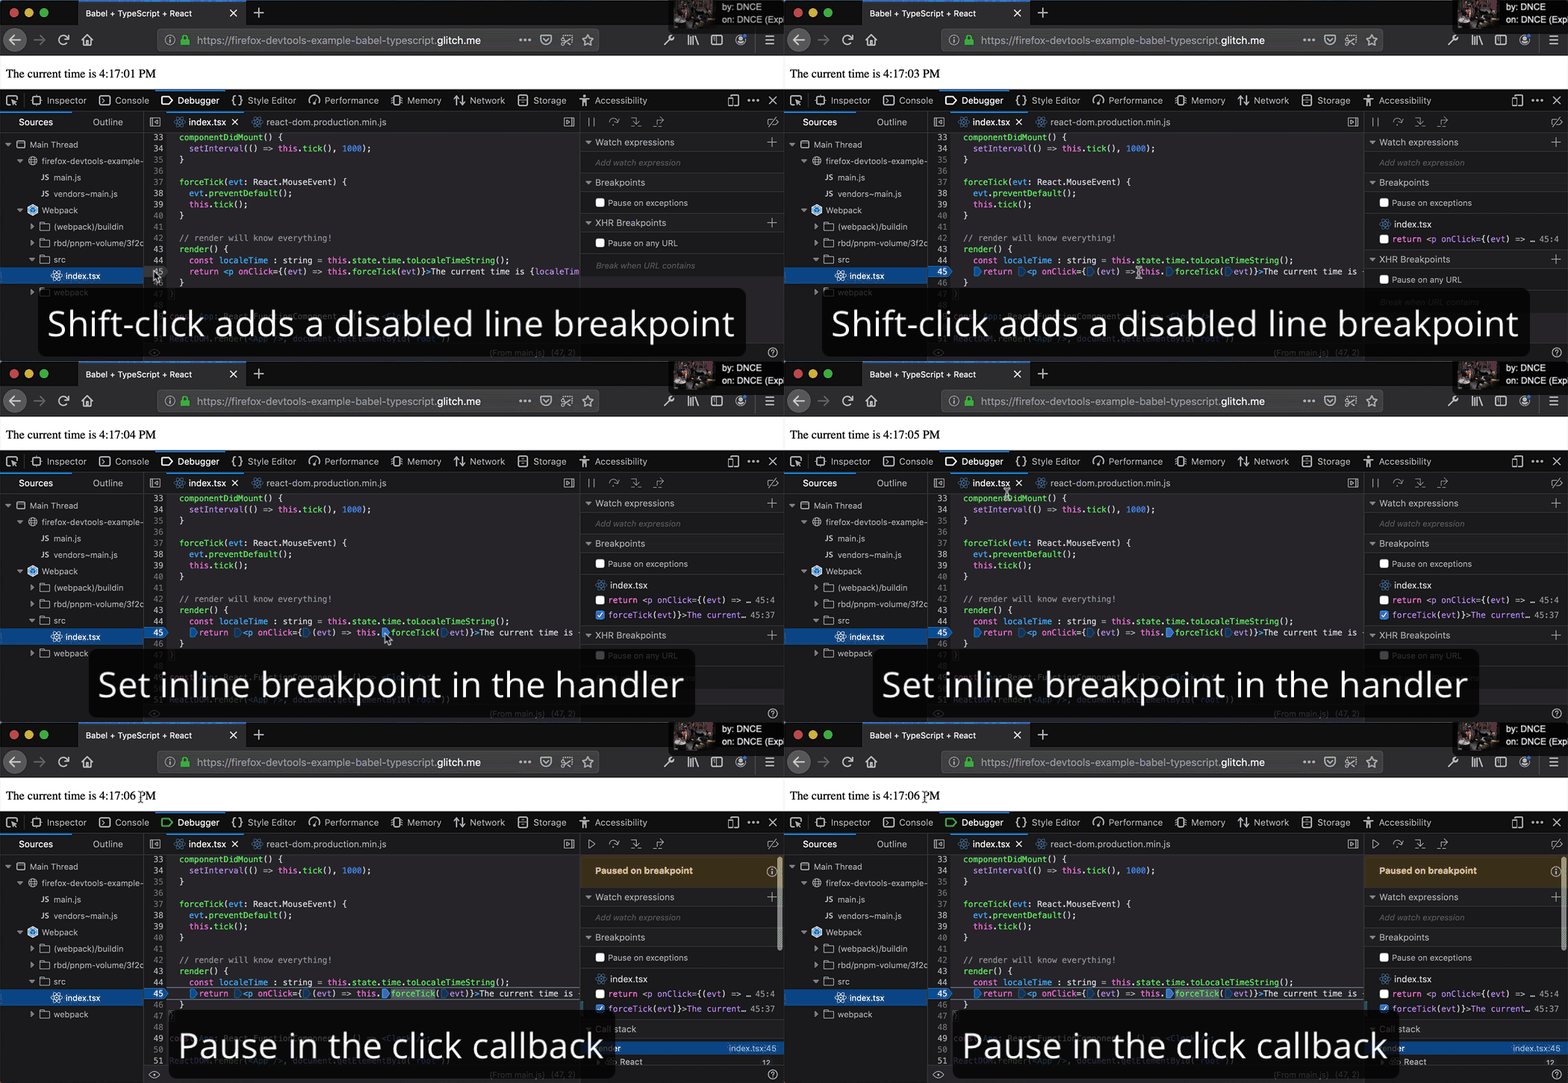
Inline handlers are the perfect match for the extra granularity.

Why should breakpoints operate on lines, when lines can have multiple statements? Thanks to inline breakpoints, it’s now easier than ever to debug minified scripts, arrow functions, and chained method calls. Learn more about breakpoints on MDN or try out the demo.

Logpoints combine the power of Console and Debugger

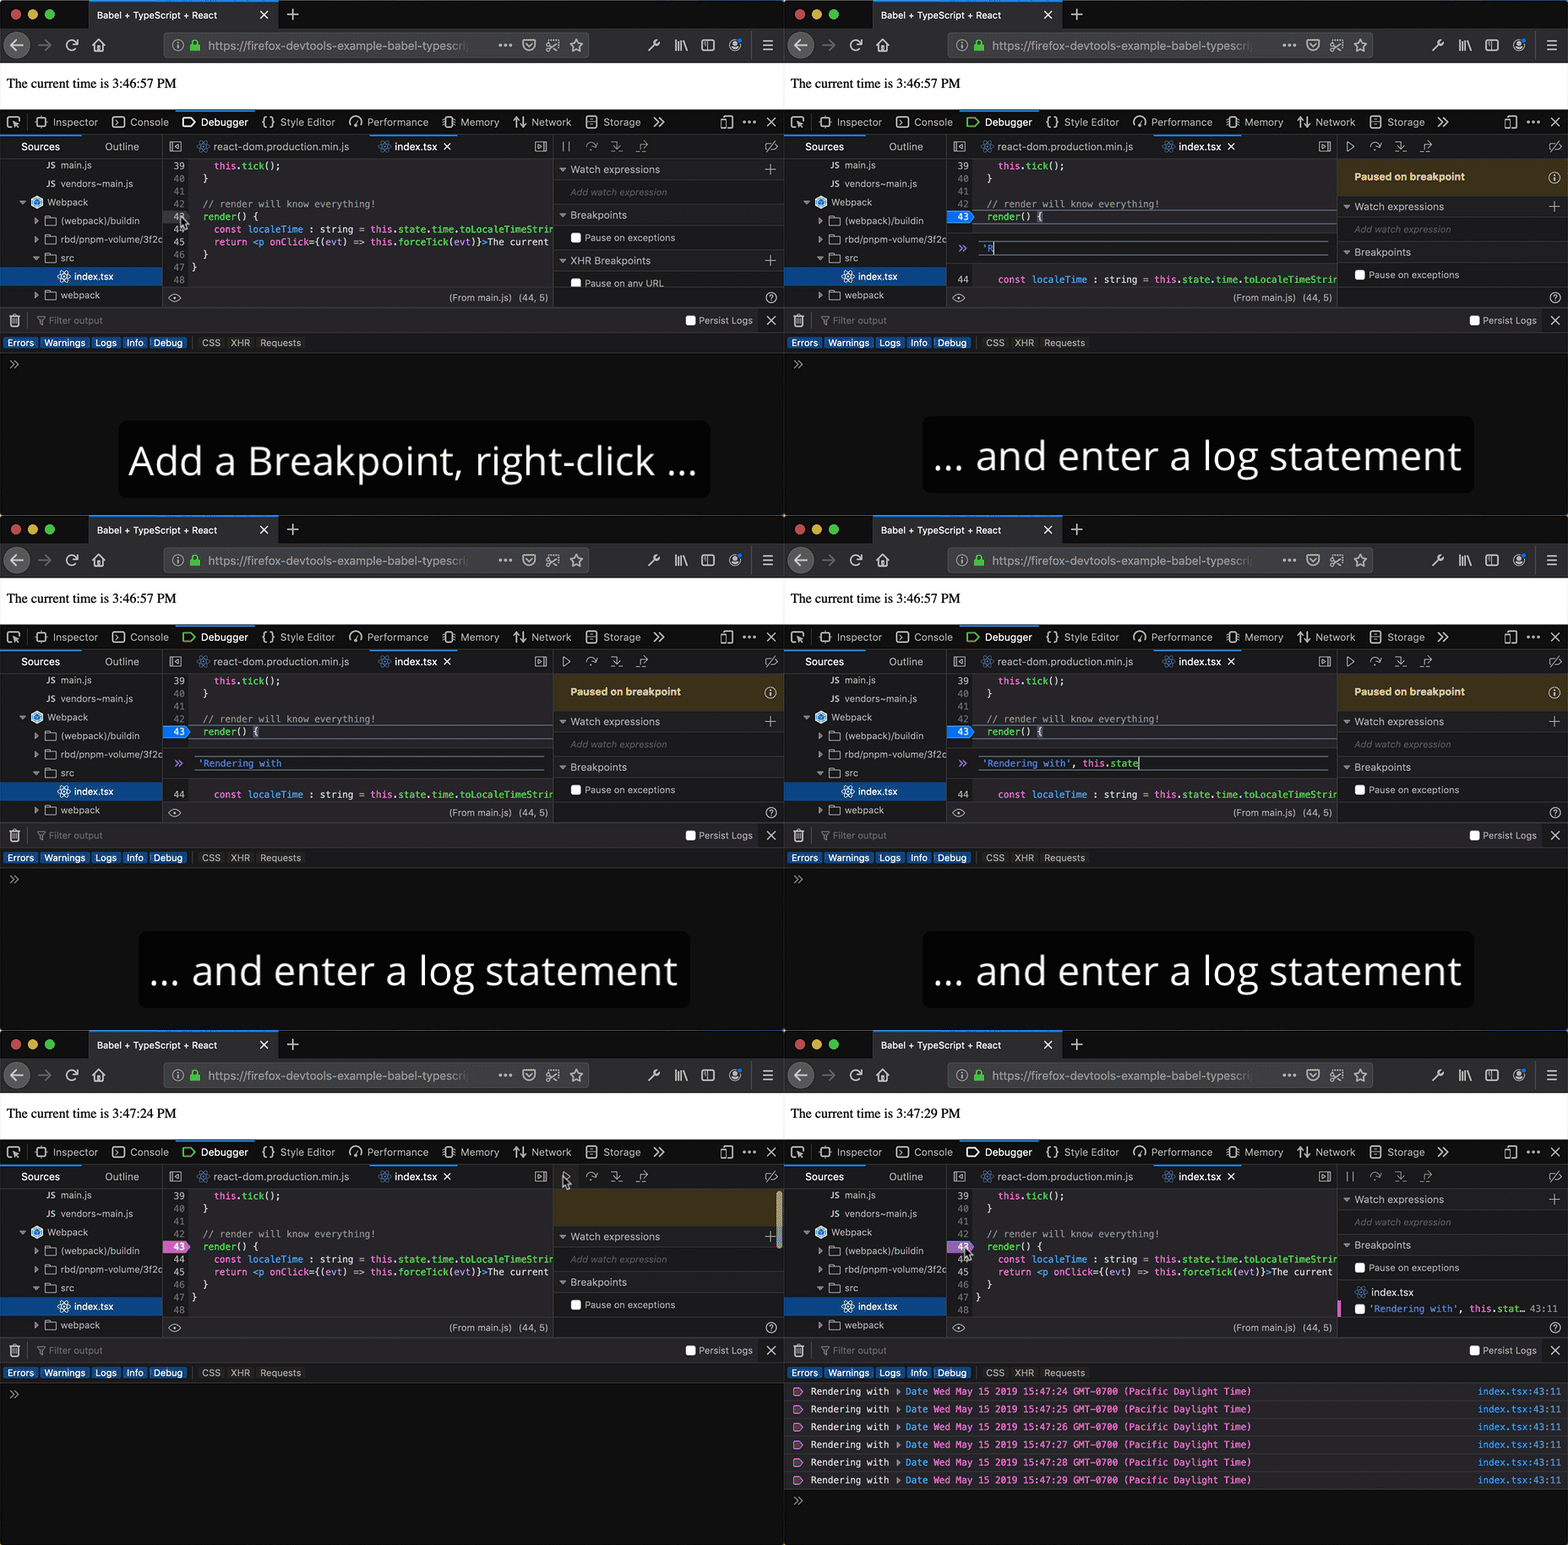
Adding Logpoints to monitor application state.

Console logging, also called printf() debugging, is a quick and easy way to observe your program’s flow, but it rapidly becomes tedious. Logpoints break that tiresome edit-build-refresh cycle by dynamically injecting console.log() statements into your running application. You can stay in the browser and monitor variables without pausing or editing any code. Learn more about log points on MDN.

Seamless debugging for JavaScript Workers

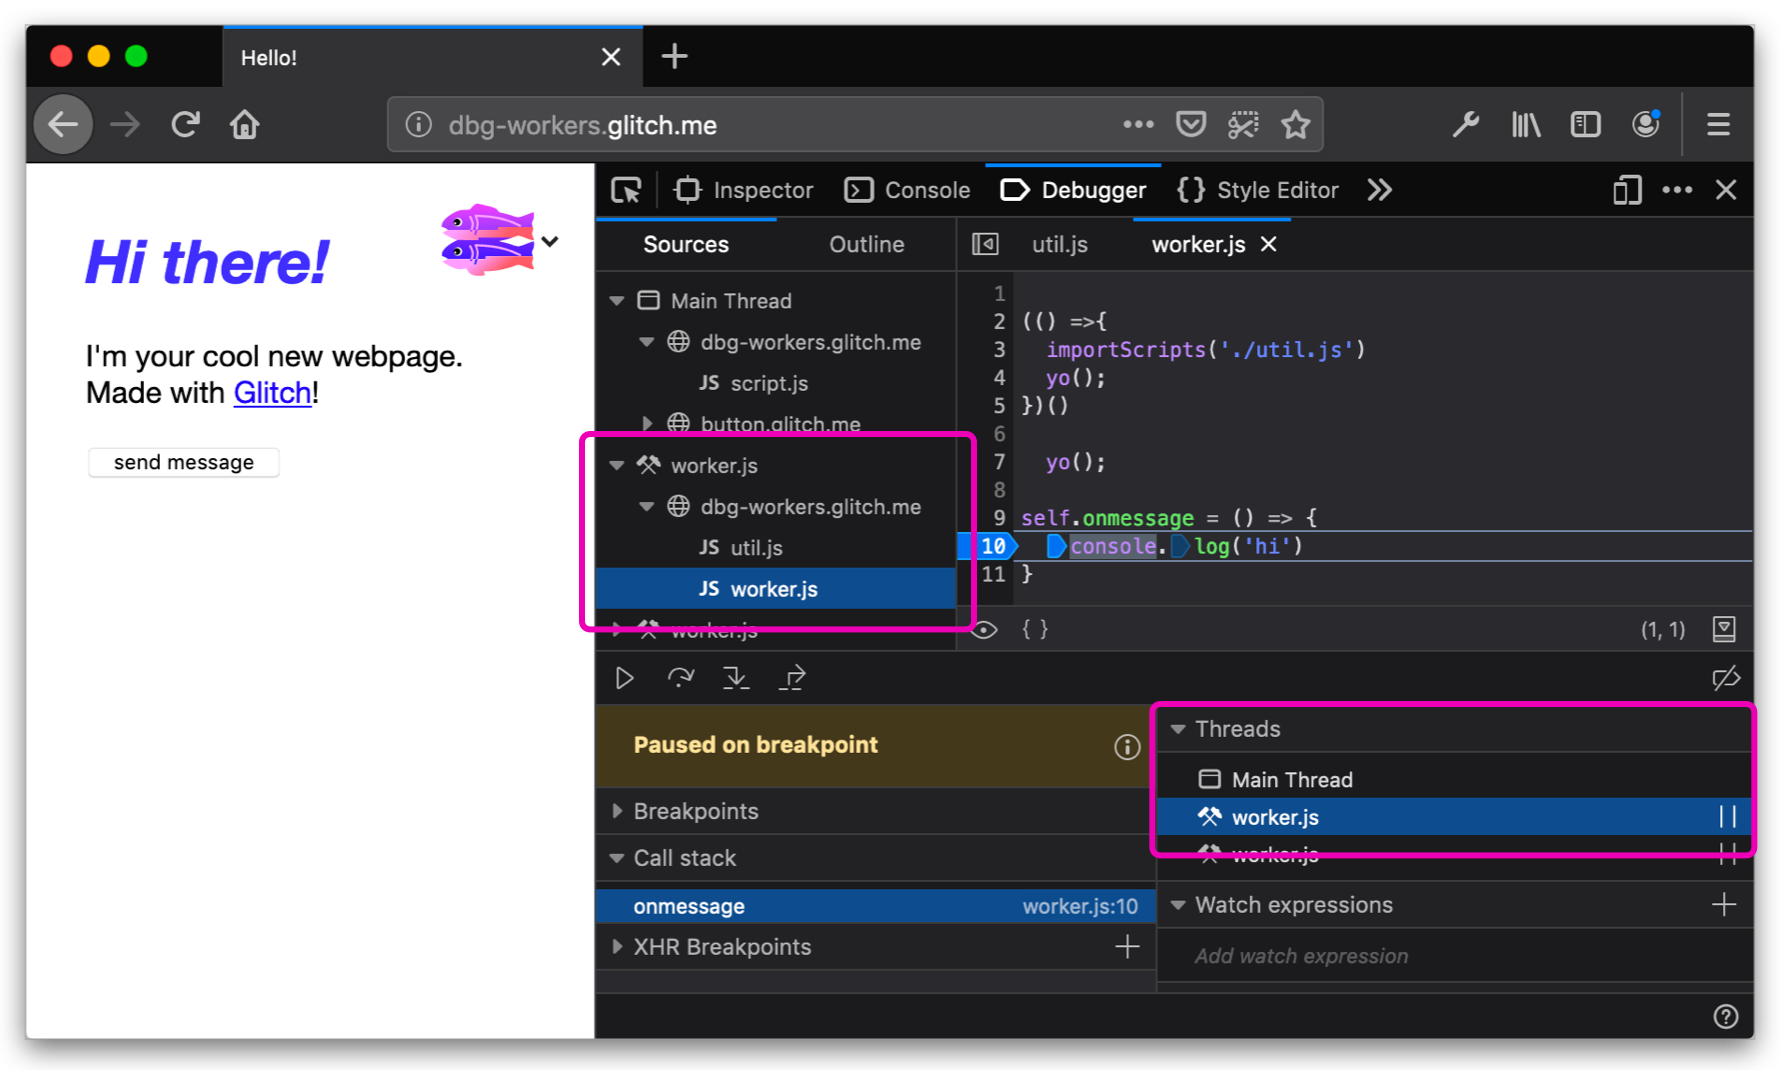
The new Threads panel in the Debugger for Worker debugging

Web Workers power the modern web and need to be first-class concepts in DevTools. Using the new Threads panel, you can switch between and independently pause different execution contexts. This allows workers and their scripts to be debugged within the same Debugger panel, similarly to other modern browsers. Learn more about Worker debugging on MDN.

Human-friendly variable names for source maps

Debugging bundled and compressed code isn’t easy. The Source Maps project, started and maintained by Firefox, bridges the gap between minified code running in the browser and its original, human-friendly version, but the translation isn’t perfect. Often, bits of the minified build output shine through and break the illusion. We can do better!

From build output back to original human-readable variables

By combining source maps with the Babel parser, Firefox’s Debugger can now preview the original variables you care about, and hide the extraneous cruft from compilers and bundlers. This can even work in the console, automatically resolving human-friendly identifiers to their actual, minified names behind the scenes. Due to its performance overhead, you have to enable this feature separately by clicking the “Map” checkbox in the Debugger’s Scopes panel. Read the MDN documentation on using the map scopes feature.

What’s next

Developers frequently need to switch between browsers to ensure that the web works for everyone, and we want our DevTools to be an intuitive, seamless experience. Though browsers have converged on the same broad organization for tools, we know there are still gaps in both features and UI. To help us address those gaps, please let us know where you experience friction when switching browsers in your daily work.

Your input makes a big difference

As always, we would love to hear your feedback on how we can improve DevTools and the browser.

While all these updates will be ready to try out in Firefox 67, when it’s released next week, we’ve polished them to perfection in Firefox 68 and added a few more goodies. Download Firefox Developer Edition (68) to try the latest updates for devtools and platform now.

About Harald Kirschner (digitarald)

Harald "digitarald" Kirschner is a Product Manager for Firefox's Developer Experience and Tools – striving to empower creators to code, design & maintain a web that is open and accessible to all. During his 8 years at Mozilla, he has grown his skill set amidst performance, web APIs, mobile, installable web apps, data visualization, and developer outreach projects.

More articles by Harald Kirschner (digitarald)…


31 comments

  1. Billal BEGUERADJ

    Excellent source map support.

    Hmmm … not sure when I compare it to Google Chrome.

    Billal BEGUERADJ

    May 17th, 2019 at 03:00

    1. Harald Kirschner (digitarald)

      What kind of project isn’t working for you? Generated source maps come in many flavors and quirks, so we are expanding to cover more edge cases.

      May 17th, 2019 at 09:59

  2. Saru

    Sorry, but Chrome’s dev tools are way better.

    May 17th, 2019 at 04:57

    1. Harald Kirschner (digitarald)

      Valid point Saru, there are definitely areas where DevTools have focused more energy and charged ahead; so depending on your cases and your experience/training some tools might just feel better than another. I hope you have a chance to try out our improvements and maybe have specific feedback on where you experience gaps.

      May 17th, 2019 at 09:58

  3. Vincent

    Very happy to see inline debugging support. Great work!

    May 17th, 2019 at 12:28

  4. artalar

    Thanks for your work!
    It’s time to try Firefox for my dev environment.

    May 17th, 2019 at 22:14

  5. Olga

    I love the idea of Logpoints. Breakpoints are great but sometimes they are not enough (e.g. drag and drop debugging). I’ve already switched to Firefox to use it for my personal stuff. I need to find time to learn how to use it also for my work.

    May 17th, 2019 at 23:05

  6. Yoh Adams

    Cool, cool, but when will you add ability to look inside of websockety frames?

    May 17th, 2019 at 23:42

    1. Harald Kirschner (digitarald)

      Work is starting and expected to be ready for 70, maybe 69.

      May 20th, 2019 at 08:46

  7. Edmund

    Great features! I’ll be trying it out today.

    May 18th, 2019 at 03:16

  8. Mark

    Looks great cannot wait to give it a try, nice to have an alternative to the google chocolate factory which is probably selling your debugging algorithm to the the highest bidding advertisers.. thanks for all your hard work..

    May 19th, 2019 at 11:59

  9. Ivan Enderlin

    Excellent job, congrats! Thanks for putting so much effort :-)!

    May 21st, 2019 at 00:17

  10. Rafael Ramalho

    Hi guys. Can you try and focus on improving the network tab experience? It’s really hard to navigate through complex json structures and to search for specific key/values in the response.

    If it wasn’t for that, I wouldn’t have switched back to Chrome

    May 21st, 2019 at 02:40

    1. Harald Kirschner (digitarald)

      I filed https://bugzilla.mozilla.org/show_bug.cgi?id=1553201 , but could not find a gap to address yet. Maybe you can comment in the bug or here.

      We have search in all panels of a response. Might it be just the missing highlight for matching search tokens that makes this harder?

      May 21st, 2019 at 08:51

  11. Da Scritch

    Very good work, but source map seems still buggy with Google (surprise?) Closure Compiler

    Example : https://github.com/dascritch/cpu-audio/blob/master/dist/cpu-audio.js with https://github.com/dascritch/cpu-audio/blob/master/dist/cpu-audio.js.map

    Level = SIMPLE
    –isolation_mode=IIFE
    with a multiline commented prologue (see make.sh)

    May 21st, 2019 at 08:04

    1. Harald Kirschner (digitarald)

      Thanks for the detailed report. While filing a bug report : https://bugzilla.mozilla.org/show_bug.cgi?id=1553374 , but noticed that the online demos don’t include the source map. I assume for testing the project has to be build locally? Maybe you can comment on the bug if there are more detailed steps.

      May 21st, 2019 at 21:43

    2. FnLn

      Cool stuff. If FF debugger will get up to speed with Chrome it will be a game changer for me. I like logs. Map in stacktrace is super useful. Also awesome grid and new flexbox debuggers. Keep up with great work!

      May 27th, 2019 at 15:49

  12. Aslan

    What about UX? When will you improve your UX?

    May 22nd, 2019 at 01:00

    1. Harald Kirschner (digitarald)

      Yes, every release – sometimes more visible, sometimes just polishing interactions. Anything specific you had in mind?

      May 22nd, 2019 at 06:56

  13. MikeyB

    Damn Harald. You announce years of hard work being released and everyone just moans about other things. I’d be rage quitting right about now

    May 22nd, 2019 at 14:53

    1. Harald Kirschner (digitarald)

      Ha, this is awesome, thank you for caring Mikey! With the web platform always evolving, developers being able to bring more products to the web and tooling ecosystem being ever-changing; there will always be feedback. What makes me happy as a PM is when we can identify the reoccurring themes and knock them out one by one – like we did with the work documented here, and again reflected in the feedback I collected in various channels in response to this post.

      May 22nd, 2019 at 16:31

  14. Wykks

    Great job! Almost there, but still not enough for me unfortunatly.
    Two “major” things:
    Websocket support.
    Source map support in Performance tab. Currently, it’s completly unusable right now with a JS Framework like Angular. (Also need the abillity to click in the Flame Chart).

    May 23rd, 2019 at 06:59

    1. Harald Kirschner (digitarald)

      Websockets is coming (back).

      SM support is something we are looking at for the new Performance panel. I can see that it doesn’t work for frameworks right now, so we make sure keep that use case in mind for our work.

      May 23rd, 2019 at 09:41

  15. Rafael Corrêa Gomes

    I’ll start to use Firefox more, mainly to debug JS check these new features.

    May 23rd, 2019 at 08:08

  16. Anonymous

    Firefox devtools does not let you debug WebSockets and Server-Sent Events by inspecting incoming and outgoing messages. Neither postMessage.

    May 26th, 2019 at 02:37

    1. Harald Kirschner (digitarald)

      Yes, this has been a long-time gap – and even more painful for users as we had excellent WebSocket debugging before Firefox Quantum. It is coming back! Work started and will land in 70 . The work is written with Server-Sent Events in mind, so we hope to follow up with supporting that soon as well.

      May 29th, 2019 at 09:41

  17. Thomas

    Great news and great work! :-)
    Is there any timeline on service-worker inspectability in Firefox? Or am I missing the correct place and it’s already there?

    May 29th, 2019 at 04:06

    1. Harald Kirschner (digitarald)

      about:debugging has major aspects of it right now. Work is happening right now (behind a pref devtools.application.enabled) to land an app panel similar to Chrome. We hope to get this into users’ hands in 70.

      May 29th, 2019 at 09:30

  18. David

    With the last update (Quantum 67), I am not able to debug any session dependent script anymore.
    Now it seems the js-source files for the debugger are loaded outside of the current browser session. So I am not able to debug any js that depends on the session of the user…

    June 3rd, 2019 at 02:07

    1. Harald Kirschner (digitarald)

      David could you try in DevEdition and see if that fixes the issue – if not also try Nightly – and if that is broken file a bug https://bugzilla.mozilla.org/enter_bug.cgi? We already found some new source-loading related issues caused by fixing old source-loading bugs – some of that already fixed – and will try to more fixes into DevEdition.

      June 3rd, 2019 at 06:57

      1. David

        Unfortunately, neither the developer nor the nightly edition has a fix for the issue.

        I have filed a bug-report.

        But I really like the developer edition:-)

        June 4th, 2019 at 07:06

Comments are closed for this article.