
We just released Firefox 65 with a number of new developer features that make it even easier for you to create, inspect and debug the web.
Among all the features and bug fixes that made it to DevTools in this new release, we want to highlight two in particular:
- Our brand new Flexbox Inspector
- Smarter JavaScript inspection and debugging
We hope you’ll love using these tools just as much as we and our community loved creating them.
Understand CSS layout like never before
The Firefox DevTools team is on a mission to help you master CSS layout. We want you to go from “trying things until they work” to really understanding how your browser lays out a page.
Introducing the Flexbox Inspector
Flexbox is a powerful way to organize and distribute elements on a page, in a flexible way.
To achieve this, the layout engine of the browser does a lot of things under the hood. When everything works like a charm, you don’t have to worry about this. But when problems appear in your layout it may feel frustrating, and you may really need to understand why elements behave a certain way.
That’s exactly what the Flexbox Inspector is focused on.
Highlighting containers, lines, and items
First and foremost, the Flexbox Inspector highlights the elements that make up your flexbox layout: the container, lines and items.
Being able to see where these start and end — and how far apart they are — will go a long way to helping you understand what’s going on.
Once toggled, the highlighter shows three main parts:
- A dotted outline that highlights the flex container itself
- Solid lines that show where the flex items are
- A background pattern that represents the free space between items
One way to toggle the highlighter for a flexbox container is by clicking its “flex” badge in the inspector. This is an easy way to find flex containers while you’re scanning elements in the DOM. Additionally, you can turn on the highlighter from the flex icon in the CSS rules panel, as well as from the toggle in the new Flexbox section of the layout sidebar.
Understanding how flex items got their size
The beauty of Flexbox is that you can leave the browser in charge of making the right layout decisions for you. How much should an element stretch, or should an element wrap to a new line?
But when you give up control, how do you know what the browser is actually doing?
The Flexbox Inspector comes with functionality to show how the browser distributed the sizing for a given item.
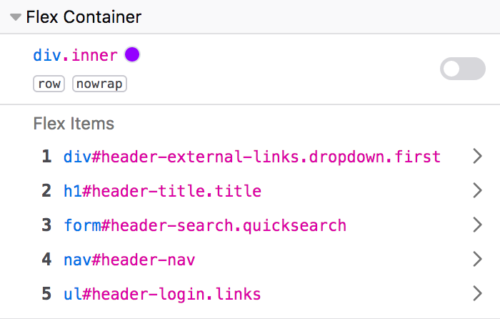
The layout sidebar now contains a Flex Container section that lists all the flex items, in addition to providing information about the container itself.
Clicking any of these flex items opens the Flex Item section that displays exactly how the browser calculated the item size.
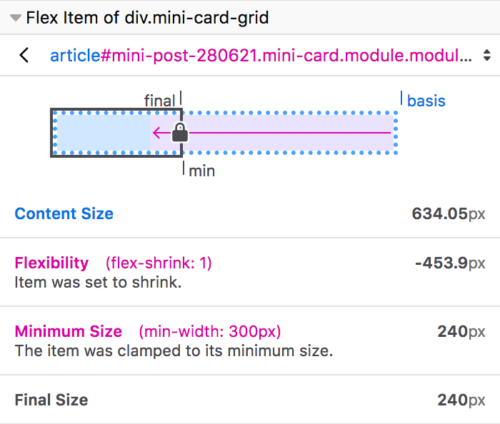
The diagram at the top of the flexbox section shows a quick overview of the steps the browser took to give the item its size.
It shows your item’s base size (either its minimum content size or its flex-basis size), the amount of flexible space that was added (flex-grow) or removed (flex-shrink) from it, and any minimum or maximum defined sizes that restricted the item from becoming any shorter or longer.
If you are reading this on Firefox 65, you can take this for a spin right now!
Open the Inspector on this page, and select the div.masthead.row element. Look for the Flex Container panel in the sidebar, and click on the 2 items to see how their sizes are computed by the browser.
After the bug fix, keep track of changes
Let’s suppose you have fixed a flexbox bug thanks to the Flexbox Inspector. To do so, you’ve made a few edits to various CSS rules and elements. That’s when you’re usually faced with a problem we’ve all had: “What did I actually change to make it work?”.
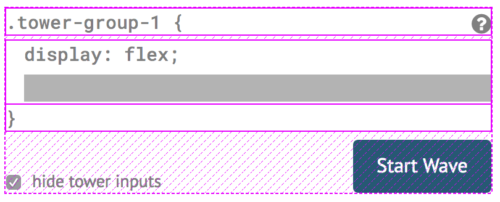
In Firefox 65, we’ve also introduced a new Changes panel to do just that.
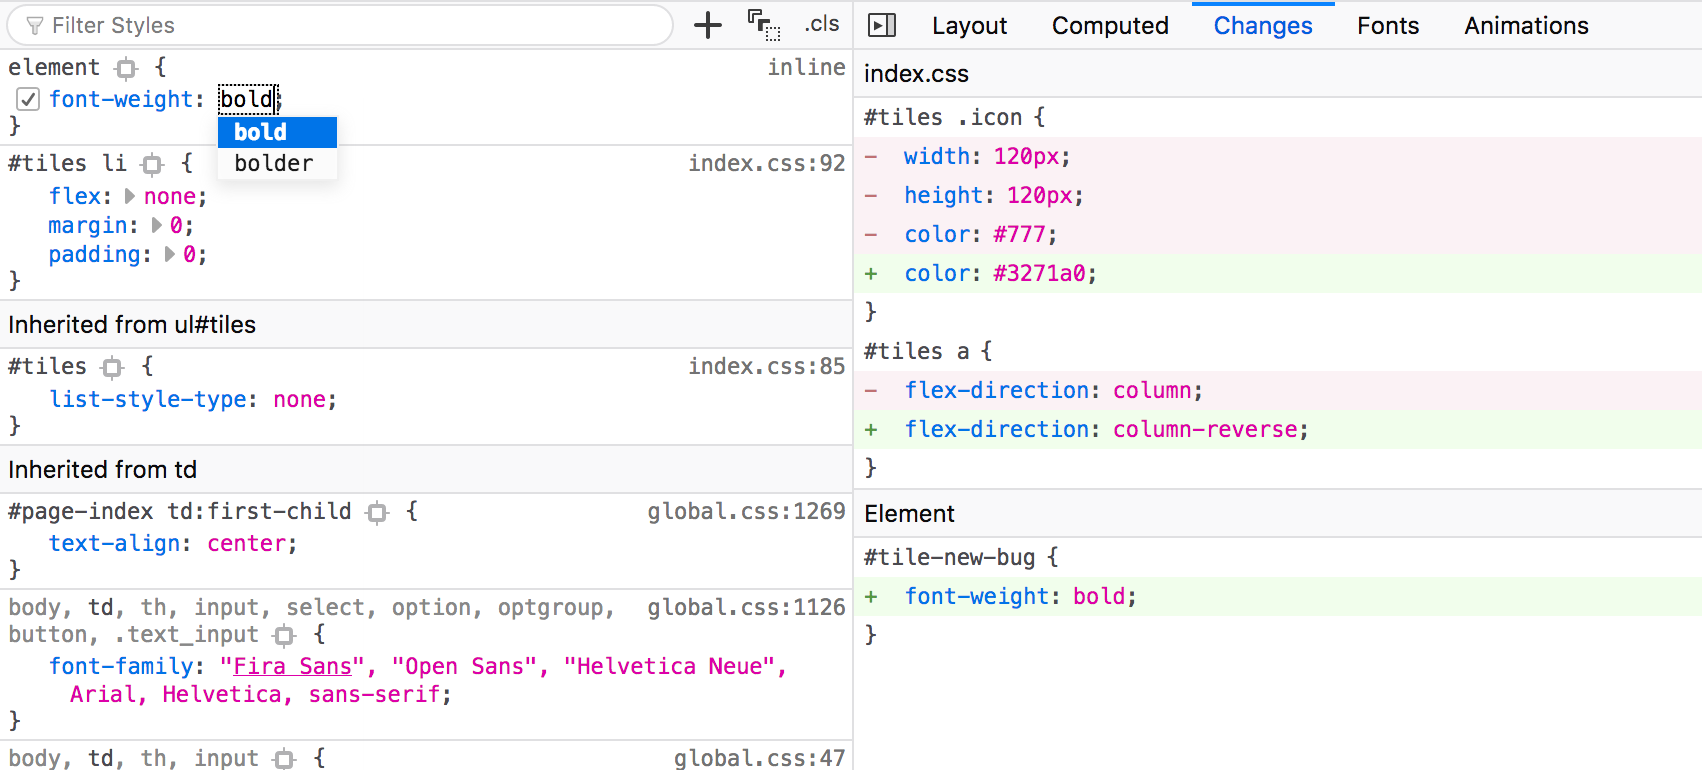
It keeps track of all the CSS changes you’ve made within the inspector, so you can keep working as you normally would. Once you’re happy, open the Changes tab and see everything you did.
What’s next for layout tools?
We’re really excited for you to try these two new features and let us know what you think. But there’s more in store.
You’ve been telling us exactly what your biggest CSS challenges are, and we’ve been listening. We’re currently prototyping layout tools for debugging unwanted scrollbars, z-indexes that don’t work, and more tools like the Flexbox Inspector but for other types of layouts. Also, we’re going to make it even easier for you to extract your changes from the Changes panel.
Smarter JavaScript inspection & debugging
When developing JavaScript, the Console and Debugger are your windows into your code’s execution flow and state changes. Over the past releases we’ve focused on making debugging work better for modern toolchains. Firefox 65 continues this theme.
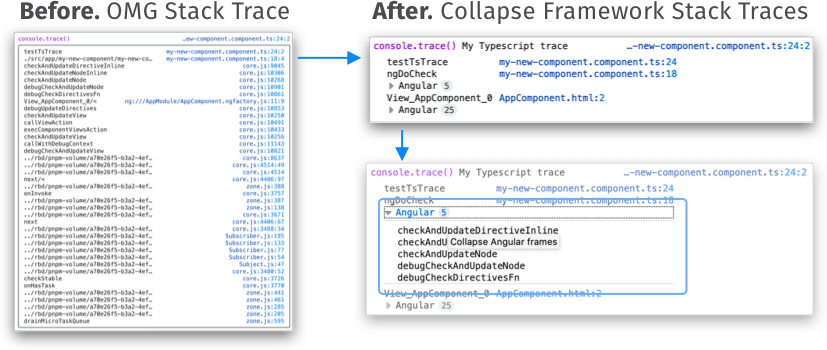
Collapsing Framework Stack Traces
If you’re working with frameworks and build tools, then you’re used to seeing really long error stack traces in the Console. The new smarter stack traces identify 3rd party code (such as frameworks) and collapse it by default. This significantly reduces the information displayed in the Console and lets you focus on your code.
The Collapsing feature works in the Console stack traces for errors and logs, and in the Debugger call stacks.
Reverse search your Console history
If you are tired of smashing the arrow key to find that awesome one-liner you ran one hour ago in the console, then this is for you. Reverse search is a well known command-line feature that lets you quickly browse recent commands that match the entered string.
To use it in the Console, press F9 on Windows/Linux or Ctrl+R on MacOS and start typing. You can then use Ctrl+R to move to the previous or Ctrl+S to the next result. Finally, hit return to confirm.
Invoke getters to inspect the return value
JavaScript getters are very useful for dynamic properties and heavily used in frameworks like vue.js for computed properties. But when you log an object with a getter to the Console, the reference to the method is logged, not its return value. The method does not get invoked automatically, as that could change your application’s state. Since you often actually want to see the value, you can now manually invoke getters on logged objects.
Wherever objects can be inspected, in the Console or Debugger, you’ll see >> icons next to getters. Clicking these will execute the method and print the return value.
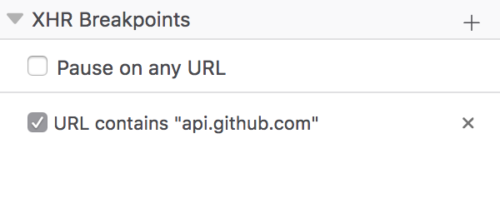
Pause on XHR/Fetch Breakpoints
Console logging is just one aspect of understanding application state. For complex issues, you need to pause state at precisely the right moment. Fetching data is usually one of those moments, and it is now made “pausable” with the new XHR/Fetch Breakpoint in the Debugger.
Kudos to Firefox DevTools code contributor Anshul Malik for “casually” submitting the patch for this useful feature and for his ongoing contributions.
What’s next for JavaScript debugging?
You might have noticed that we’ve been heads down over recent releases to make the JavaScript debugging experience rock solid – for breakpoints, stepping, source maps, performance, etc. Raising the quality bar and continuing to polish and refine remains the focus for the entire team.
There’s work in progress on much requested features like Column Breakpoints, Logpoints, Event and DOM Breakpoints. Building out the authoring experience in the Console, we are adding an multi-line editing mode (inspired by Firebug) and a more powerful autocomplete. Keep an eye out for those features in the latest release of Firefox Developer Edition.
Thank you
Countless contributors helped DevTools staff by filing bugs, writing patches and verifying them. Special thanks go to:
- Zameer Haque: Improved contrast for resource status in the Console.
- Heng Yeow: Added the Referrer-Policy to the resource Headers list in the Network panel (and fixed other bugs).
- Adam Holm: Updated the design for the Edit & Resend dialog in the Network panel.
- Ariel Burone: Swapped the Domain and File column in the Network panel.
Also, thanks to Patrick Brosset, Nicolas Chevobbe and the whole DevTools team & friends for helping put together this article.
Contribute
As always, we would love to hear your feedback on how we can improve DevTools and the browser.
- File bug reports in Bugzilla
- Chat with us in the Firefox DevTools Slack
- Share ideas and questions in Mozilla’s Developer Tools Discourse
- Tweet us at @FirefoxDevTools
Download Firefox Developer Edition to get early access to upcoming tooling and platform.
About Martin Balfanz
Martin is a Product Manager at Mozilla, working on Firefox DevTools.
More articles by Martin Balfanz…
About Harald Kirschner (digitarald)
Harald "digitarald" Kirschner is a Product Manager for Firefox's Developer Experience and Tools – striving to empower creators to code, design & maintain a web that is open and accessible to all. During his 8 years at Mozilla, he has grown his skill set amidst performance, web APIs, mobile, installable web apps, data visualization, and developer outreach projects.
11 comments