
Just over 2 weeks ago Peter Smart and Robin Hawkes released the first version of ViziCities to the world. It’s free to use and open-sourced under an MIT license.
In this post I will talk to you about the lessons learnt during the development of ViziCities. From application architecture to fine-detailed WebGL rendering improvements, we learnt a lot in the past year and we hope that by sharing our experiences we can help others avoid the same mistakes.
What is ViziCities?
In a rather geeky nutshell, ViziCities is a WebGL application that allows you to visualise anywhere in the world in 3D. It’s primary purpose is to look at urban areas, though it’ll work perfectly fine in other places if they have decent OpenStreetMap coverage.
Demo
The best way to explain what ViziCities does is to try it out yourself. You’ll need a WebGL-enabled browser and an awareness that you’re using pre-alpha quality software. Click and drag your way around, zoom in using the mouse wheel, and rotate the camera by clicking the mouse wheel or holding down shift while clicking and dragging.
You can always take a look at this short video if you’re unable to try the demo right now:
What’s the point of it?
We started the project for multiple reasons. One of those reasons is that it’s an exciting technical and design challenge for us – both Peter and I thrive on pushing ourselves to the limits by exploring something unknown to us.
Another reason is that we were inspired by the latest SimCity game and how they visualise data about the performance of your city – in fact, Maxis, the developers behind SimCity reached out to us to tell us how much they like the project!
There’s something exciting about creating a way to do that for real-world cities rather than fictional ones. The idea of visualising a city in 3D with up-to-date data about that city overlaid is an appealing one. Imagine if you could see census data about your area, education data, health data, crime data, property information, live transport (trains, buses, traffic, etc), you’d be able to learn and understand so much more about the place you live.
This is really just the beginning – the possibilities are endless.
Why 3D?
A common question we get is “Why 3D?” – the short answer, beyond “because it’s a visually interesting way of looking at a city”, is that 3D allows you to do things and analyse data in ways that you can’t do in a 2D map. For example by using 3D you can take height and depth into consideration, so you can better visualise the sheer volume of stuff that lies above and below you in a city – things like pipes and underground tunnels, or bridges, overpasses, tall buildings, the weather, and planes! On a 2D map, looking at all of this would be a confusing mess, in 3D you get to see it exactly how it would look in the real world – you can easily see how objects within a city relate to each other.
Core technology
At the most basic level ViziCities is built using Three.js, a WebGL library that abstracts all the complexity of 3D rendering in the browser. We use a whole range of other technologies too, like Web Workers, each of which serves a specific purpose or solves a specific problem that we’ve encountered along the way.
Let’s take a look at some of those now.
Lessons learnt
Over the past year we’ve come from knowing practically nothing about 3D rendering and geographic data visualisation, to knowing at least enough about each of them to be dangerous. Along the way we’ve hit many roadblocks and have had to spend a significant amount of time working out what’s wrong and coming up with solutions to get around them.
The process of problem solving is one I absolutely thrive on, but it’s not for everybody and I hope that the lessons I’m about to share will help you avoid these same problems, allowing you to save time and do more important things with your life.
These lessons are in no particular order.
Using a modular, decoupled application architecture pays off in the long run
We originally started out with hacky, prototypal experiments that were dependency heavy and couldn’t easily be pulled apart and used in other experiments. Although it allowed us to learn how everything worked, it was a mess and caused a world of pain when it came to building out a proper application.
In the end we re-wrote everything based on a simple approach using the Constructor Pattern and the prototype property. Using this allowed us to separate out logic into decoupled modules, making everything a bit more understandable whilst also allowing us to extend and replace functionality without breaking anything else (we use the Underscore _.extend method to extend objects).
Here’s an example of our use of the Constructor Pattern.
To communicate amongst modules we use the Mediator Pattern. This allows us to keep things as decoupled as possible as we can publish events without having to know about who is subscribing to them.
Here’s an example of our use of the Mediator Pattern:
/* globals window, _, VIZI */
(function() {
  "use strict";

  // Apply to other objects using _.extend(newObj, VIZI.Mediator);
  VIZI.Mediator = (function() {
    // Storage for topics that can be broadcast or listened to
    var topics = {};

    // Subscribe to a topic, supply a callback to be executed
    // when that topic is broadcast to
    var subscribe = function( topic, fn ){
      if ( !topics[topic] ){
        topics[topic] = [];
      }

      topics[topic].push( { context: this, callback: fn } );

      return this;
    };

    // Publish/broadcast an event to the rest of the application
    var publish = function( topic ){
      var args;

      if ( !topics[topic] ){
        return false;
      }

      args = Array.prototype.slice.call( arguments, 1 );
      for ( var i = 0, l = topics[topic].length; i < l; i++ ) {

        var subscription = topics[topic][i];
        subscription.callback.apply( subscription.context, args );
      }
      return this;
    };

    return {
      publish: publish,
      subscribe: subscribe
    };
  }());
}());
I’d argue that these 2 patterns are the most useful aspects of the new ViziCities application architecture – they have allowed us to iterate quickly without fear of breaking everything.
Using promises instead of wrestling with callbacks
Early on in the project I was talking to my friend Hannah Wolfe (Ghost’s CTO) about how annoying callbacks are, particularly when you want to load a bunch of stuff in order. It didn’t take Hannah long to point out how stupid I was being (thanks Hannah) and that I should be using promises instead of wrestling with callbacks. At the time I brushed them off as another hipster fad but in the end she was right (as always) and from that point onwards I used promises wherever possible to take back control of application flow.
For ViziCities we ended up using the Q library, though there are plenty others to choose from (Hannah uses when.js for Ghost).
The general usage is the same whatever library you choose – you set up promises and you deal with them at a later date. However, the beauty comes when you want to queue up a bunch of tasks and either handle them in order, or do something when they’re all complete. We use this in a variety of places, most noticeably when loading ViziCities for the first time (also allowing us to output a progress bar).
I won’t lie, promises take a little while to get your head around but once you do you’ll never look back. I promise (sorry, couldn’t resist).
Using a consistent build process with basic tests
I’ve never been one to care too much about process, code quality, testing, or even making sure things are Done Right™. I’m a tinkerer and I much prefer learning and seeing results than spending what feels like wasted time on building a solid process. It turns out my tinkering approach doesn’t work too well for a large Web application which requires consistency and robustness. Who knew?
The first step for code consistency and quality was to enable strict mode and linting. This meant that the most glaring of errors and inconsistencies were flagged up early on. As an aside, due to our use of the Constructor Pattern we wrapped each module in an anonymous function so we could enable strict mode per module without necessarily enabling it globally.
At this point it was still a faff to use a manual process for creating new builds (generating a single JavaScript file with all the modules and external dependencies) and to serve the examples. The break-through was adopting a proper build system using Grunt, thanks mostly to a chat I had with Jack Franklin about my woes at an event last year (he subsequently gave me his cold which took 8 weeks to get rid of, but it was worth it).
Grunt allows us to run a simple command in the terminal to do things like automatically test, concatenate and minify files ready for release. We also use it to serve the local build and auto-refresh examples if they’re open in a browser. You can look at our Grunt setup to see how we set everything up.
For automated testing we use Mocha, Chai, Sinon.js, Sinon-Chai and PhantomJS. Each of which serves a slightly different purpose in the testing process:
- Mocha is used for the overall testing framework
- Chai is used as an assertion library to allows you to write readable tests
- Sinon.js is used to fake application logic and track behaviour through the testing process
- PhantomJS is used to run client-side tests in a headless browser from the terminal
We’ve already put together some (admittedly basic) tests and we plan to improve and increase the test coverage before releasing 0.1.0.
Travis CI is used to make sure we don’t break anything when pushing changes to GitHub. It automatically performs linting and runs our tests via Grunt when changes are pushed, including pull requests from other contributors (a life saver). Plus it lets you have a cool badge to put on your GitHub readme that shows everyone whether the current version is building successfully.

Together, these solutions have made ViziCities much more reliable than it has ever been. They also mean that we can move rapidly by building automatically, and they allow us to not have to worry so much about accidentally breaking something. The peace of mind is priceless.
Monitoring performance to measure improvements
General performance in frames-per-second can be monitored using FPSMeter. It’s useful for debugging parts of the application that are locking up the browser or preventing the rendering loop from running at a fast pace.

You can also use the Three.js renderer.info property to monitor what you’re rendering and how it changes over time.
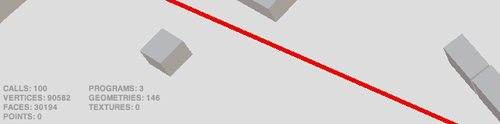
It’s worth keeping an eye on this to make sure objects are not being rendered when they move out of the current viewport. Early on in ViziCities we had a lot of issues with this not happening and the only way to be sure we to monitor these values.
Turning geographic coordinates into 2D pixel coordinates using D3.js
One of the very first problems we encountered was how to turn geographic coordinates (latitude and longitude) into pixel-based coordinates. The math involved to achieve this isn’t simple and it gets even more complicated if you want to consider different geographic projections (trust me, it gets confusing fast).
Fortunately, the D3.js library has already solved these problems for you, specifically within its geo module. Assuming you’ve included D3.js, you can convert coordinates like so:
var geoCoords = [-0.01924, 51.50358]; // Central point as [lon, lat]
var tileSize = 256; // Pixel size of a single map tile
var zoom = 15; // Zoom level

var projection = d3.geo.mercator()
  .center(geoCoords) // Geographic coordinates of map centre
  .translate([0, 0]) // Pixel coordinates of .center()
  .scale(tileSize << zoom); // Scaling value

// Pixel location of Heathrow Airport to relation to central point (geoCoords)
var pixelValue = projection([-0.465567112, 51.4718071791]); // Returns [x, y]
The scale() value is the hardest part of the process to understand. It basically changes the pixel value that’s returned based on how zoomed in you want to be (imagine zooming in on Google Maps). It took me a very long time to understand so I detailed how scale works in the ViziCities source code for others to learn from (and so I can remember!). Once you nail the scaling then you will be in full control of the geographic-to-pixel conversion process.
Extruding 2D building outlines into 3D objects on-the-fly
While 2D building outlines are easy to find, turning them into 3D objects turned out to be not quite as easy as we imagined. There’s currently no public dataset containing 3D buildings, which is a shame though it makes it more fun to do it yourself.

What we ended up using was the THREE.ExtrudeGeometry object, passing in a reference to an array of pixel points (as a THREE.Shape object) representing a 2D building footprint.
The following is a basic example that would extrude a 2D outline into a 3D object:
var shape = new THREE.Shape();
shape.moveTo(0, 0);
shape.lineTo(10, 0);
shape.lineTo(10, 10);
shape.lineTo(0, 10);
shape.lineTo(0, 0); // Remember to close the shape

var height = 10;
var extrudeSettings = { amount: height, bevelEnabled: false };

var geom = new THREE.ExtrudeGeometry( shape, extrudeSettings );
var mesh = new THREE.Mesh(geom);
What turned out interesting was how it actually turned out quicker to generate 3D objects on-the-fly than to pre-render them and load them in. This was mostly due to the fact it would take longer to download a pre-rendered 3D object than downloading the 2D coordinates string and generating it at runtime.
Using Web Workers to dramatically increase performance and prevent browser lockup
One thing we did notice with the generation of 3D objects was that it locked up the browser, particularly when processing a large number of shapes at the same time (you know, like an entire city). To work around this we delved into the magical world of Web Workers.
Web Workers allow you to run parts of your application in a completely separate processor thread to the browser renderer, meaning anything that happens in the Web Worker thread won’t slow down the browser renderer (ie. it won’t lock up). It’s incredibly powerful but it can also be incredibly complicated to get working as you want it to.
We ended up using the Catiline.js Web Worker library to abstract some of the complexity and allow us to focus on using Web Workers to our advantage, rather than fighting against them. The result is a Web Worker processing script that’s passed 2D coordinate arrays and returns generated 3D objects.
After getting this working we noticed that while the majority of browser lock-ups were eliminated, there were two new lock-ups introduced. Specifically, there was a lock-up when the 2D coordinates were passed into the Web Worker scripts, and another lock-up when the 3D objects were returned back to the main application.
The solution to this problem came from the inspiring mind of Vladimir Agafonkin (of LeafletJS fame). He helped me understand that to avoid the latter of the lock-ups (passing the 3D objects back to the application) I needed to use transferrable objects), namely ArrayBuffer objects. Doing this allows you to effectively transfer ownership of objects created within a Web Worker thread to the main application thread, rather than copying them. We implemented this to great effect, eliminating the second lock-up entirely.
To eliminate the first lock-up (passing 2D coordinates into the Web Worker) we need to take a different approach. The problem lies again with the copying of the data, though in this case you can’t use transferrable objects. The solution instead lies in loading the data into the Web Worker script using the importScripts method. Unfortunately, I’ve not yet worked out a way to do this with dynamic data sourced from XHR requests. Still, this is definitely a solution that would work.
Using simplify.js to reduce the complexity of 2D shapes before rendering
Something we found early on was that complex 2D shapes caused a lot of strain when rendered as 3D objects en-masse. To get around this we use Vladimir Agafonkin’s simplify.js library to reduce the quality of 2D shapes before rendering.

It’s a great little tool that allows you to keep the general shape while dramatically reducing the number of points used, thus reducing its complexity and render cost. By using this method we could render many more objects with little to no change in how the objects look.
Getting accurate heights for buildings is really difficult
One problem we never imagined encountering was getting accurate height information for buildings within a city. While the data does exist, it’s usually unfathomably expensive or requires you to be in education to get discounted access.
The approach we went for uses accurate height data from OpenStreetMap (if available), falling back to a best-guess that uses the building type combined with 2D footprint area. In most cases this will give a far more accurate guess at the height than simply going for a random height (which is how we originally did it).
Restricting camera movement to control performance
The original dream with ViziCities was to visualise an entire city in one go, flying around, looking down on the city from the clouds like some kind of God. We fast learnt that this came at a price, a performance price, and a data-size price. Neither of which we were able to afford.
When we realised this wasn’t going to be possible we looked at how to approach things from a different angle. How can you feel like you’re looking at an entire city without rendering an entire city? The solution was deceptively simple.
By restricting camera movement to only view a small area at a time (limiting zoom and rotation) you’re able to have much more control over how many objects can possibly be in view at one time. For example, if you prevent someone from being able to tilt a camera to look at the horizon then you’ll never need to render every single object between the camera and the edge of your scene.
This simple approach means that you can go absolutely anywhere in the world within ViziCities, whether a thriving metropolis or a country-side retreat, and not have to change the way you handle performance. Every situation is predictable and therefore optimisable.
Tile-based batching of objects to improve loading and rendering performance
Another approach we took to improve performance was by splitting the entire world into a grid system, exactly like how Google and other map providers do things. This allows you to load data in small chunks that eventually build up to a complete image.
In the case of ViziCities, we use the tiles to only request JSON data for the geographic area visible to you. This means that you can start outputting 3D objects as each tile loads rather than waiting for everything to load.
A by-product of this approach is that you get to benefit from frustum culling, which is when objects not within your view are not rendered, dramatically increasing performance.
Caching of loaded data to save on time and resources when viewing the same location
Coupled with the tile-based loading is a caching system that means that you don’t request the same data twice, instead pulling the data from a local store. This saves bandwidth but also saves time as it can take a while to download each JSON tile.
We currently use a dumb local approach that resets the cache on each refresh, but we plan to implement something like localForage to have the cache persist between browser sessions.
Using the OpenStreetMap Overpass API rather than rolling your own PostGIS database
Late into the development of ViziCities we realised that it was unfeasible to continue using our own PostGIS database to store and manipulate geographic data. For one, it would require a huge server just to store the entirety of OpenStreetMap in a database, but really it was just a pain to set up and manage and an external approach was required.
The solution came in the shape of the Overpass API, an external JSON and XML endpoint to OpenStreetMap data. Overpass allows you to send a request for specific OpenStreetMap tags within a bounding box (in our case, a map tile):
http://overpass-api.de/api/interpreter?data=[out:json];((way(51.50874,-0.02197,51.51558,-0.01099)[%22building%22]);(._;node(w);););out;
And get back a lovely JSON response:
{
  "version": 0.6,
  "generator": "Overpass API",
  "osm3s": {
    "timestamp_osm_base": "2014-03-02T22:08:02Z",
    "copyright": "The data included in this document is from www.openstreetmap.org. The data is made available under ODbL."
  },
  "elements": [

{
  "type": "node",
  "id": 262890340,
  "lat": 51.5118466,
  "lon": -0.0205134
},
{
  "type": "node",
  "id": 278157418,
  "lat": 51.5143963,
  "lon": -0.0144833
},
...
{
  "type": "way",
  "id": 50258319,
  "nodes": [
    638736123,
    638736125,
    638736127,
    638736129,
    638736123
  ],
  "tags": {
    "building": "yes",
    "leisure": "sports_centre",
    "name": "The Workhouse"
  }
},
{
  "type": "way",
  "id": 50258326,
  "nodes": [
    638736168,
    638736170,
    638736171,
    638736172,
    638736168
  ],
  "tags": {
    "building": "yes",
    "name": "Poplar Playcentre"
  }
},
...
  ]
}
The by-product of this was that you get worldwide support out of the box and benefit from minutely OpenSteetMap updates. Seriously, if you edit or add something to OpenStreetMap (please do) it will show up in ViziCities within minutes.
Limiting the number of concurrent XHR requests
Something we learnt very recently was that spamming the Overpass API endpoint with a tonne of XHR requests at the same time wasn’t particularly good for us nor for Overpass. It generally caused delays as Overpass rate-limited us so data took a long time to make its way back to the browser. The great thing was that by already using promises to manage the XHR requests we were half-way ready to solve the problem.
The final piece of the puzzle is to use throat.js to limit the number of concurrent XHR requests so we can take control and load resources without abusing external APIs. It’s beautifully simple and worked perfectly. No more loading delays!
Using ViziCities in your own project
I hope that these lessons and tips have helped in some way, and I hope that it encourages you to try out ViziCities for yourself. Getting set up is easy and well documented, just head to the ViziCities GitHub repo and you’ll find everything you need.
Contributing to ViziCities
Part of the reason why we opened up ViziCities was to encourage other people to help build it and make it even more awesome than Peter and I could ever make it. Since launch, we’ve had over 1,000 people favourite the project on GitHub, as well as nearly 100 forks. More importantly, we’ve had 9 Pull Requests from members of the community who we didn’t previously know and who we’ve not asked to help. It’s such an amazing feeling to see people help out like that.
If we were to pick a favourite contribution so far, it would be adding the ability to load anywhere in the world by putting coordinates in the URL. Such a cool feature and one that has made the project much more usable for everyone.
We’d love to have more people contribute, whether dealing with issues or playing with the visual styling. Read more about how to contribute and give it a go!
What’s next?
It’s been a crazy year and an even crazier fortnight since we launched the project. We never imagined it would excite people in the way it has, it’s blown us away.
The next steps are slowly going through the issues and getting ready for the 0.1.0 release, which will still be alpha quality but will be sort of stable. Aside from that we’ll continue experimenting with exciting new technologies like the Oculus Rift (yes, that’s me with one strapped to my face)…

Visualising realtime air traffic in 3D…
And much, much more. Watch this space.
About Robin Hawkes
Robin thrives on solving problems through code. He's a Digital Tinkerer, Head of Developer Relations at Pusher, former Evangelist at Mozilla, book author, and a Brit.
More articles by Robin Hawkes…
About Robert Nyman [Editor emeritus]
Technical Evangelist & Editor of Mozilla Hacks. Gives talks & blogs about HTML5, JavaScript & the Open Web. Robert is a strong believer in HTML5 and the Open Web and has been working since 1999 with Front End development for the web - in Sweden and in New York City. He regularly also blogs at http://robertnyman.com and loves to travel and meet people.
2 comments