
Over the years, engineering teams at Mozilla have introduced tooling for code quality. This toolchain works at various stages of the complex Firefox development cycle. In this article we’ll take a look at the types of tools we’ve developed, some of the challenges they address, and the architecture solutions we’ve developed. When we talk about code quality tools, we are referring to the following categories of tool:
- static analysis
- linting
- coding style
- code coverage
In general, for development projects on a smaller scale than building the Firefox desktop browser, simple CI (continuous integration) jobs are relatively easy to set up and configure. They target a limited number of languages. Many setups and CI platforms are available for developers.
Firefox is a vast (21M lines of code) open source software project which grew from Netscape in 1998. We use multiple languages (C++, Rust, JavaScript, Python, and more), manage hundreds of changes every day, and handle a repository of several gigabytes at scale. This makes for some unique challenges.
Tools
In this post, we are not going to list all the tools that we run. Instead we will focus on the why and how of our tooling.
You can find all the details of all of the tools in our documentation: https://firefox-source-docs.mozilla.org/code-quality/
As it is hard to impose tooling (for example, hooks) on the workstations of Firefox developers, we decided to focus our effort on running these tools at the review phase.
Challenges
Different types of failure
There are different types of failure when we test for quality. That’s our first challenge:
- Certain issues will always break the CI (continuous integration), with no false positives (build errors, some mandatory formatting rules not respected, etc.).For example, we have custom C++ checkers specific to our code base. We know that they will cause problems in the product. Therefore, we make sure to break the CI to prevent the code from landing and making trouble in the product.
- Potential mistakes: Depending on your point of view, C/C++ are either too complex, or they are just problematic languages. Therefore some tools (static analyzers) have been developed to prevent problems from occurring. However, these checkers have false positive reports. (Otherwise, they would be errors triggered by the compiler.)
- For example – clang-tidy `performance-unnecessary-value-param
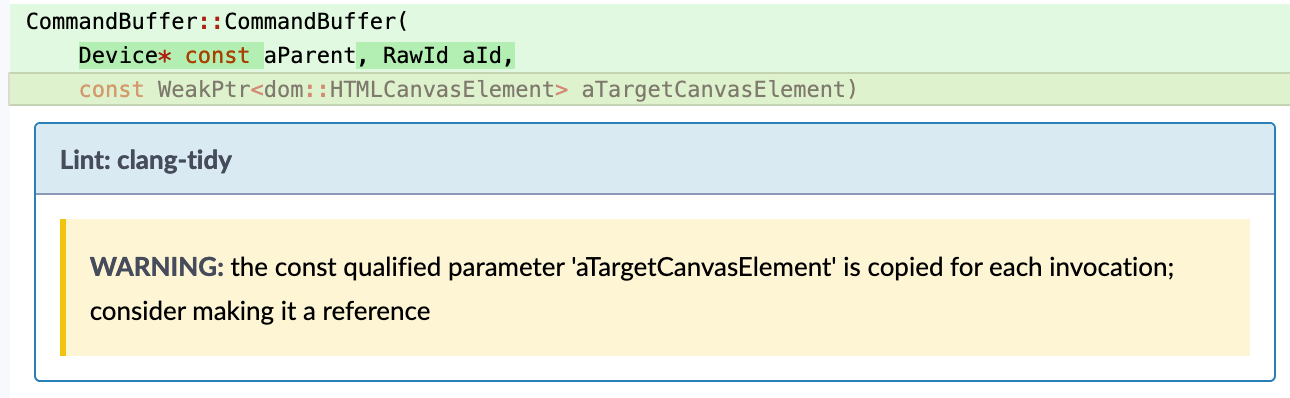
- For example – clang-tidy `performance-unnecessary-value-param
- Nice-to-have tooling: Checkers that can bring more consistency in the code base. These make the code more readable, and mitigate technical debt.
Size of the code base
Our next major challenge: We are dealing with 21 million lines of code. We cannot fix all the hundreds of existing issues before enabling a new checker, and we don’t want to force developers to fix all pre-existing issues that are not due to their proposed changes. So, operating at this scale, we’ve had to come up with different solutions.
To address this, we have identified and deployed two solutions. When the issues have been easy to fix (e.g. eslint, flake8, etc), we’ve created and maintained a list of directories/files on which they could run, and progressively fixed issues in more and more directories.
For more complex checkers like the C++ static analyzer, we’ve developed some heuristics to identify if an issue is new or not. Either we create a list of previously tolerated usage (example: deprecated thread usage) or we evaluate with some heuristics if the defect is new or already existing.
Architecture
The biggest advantage of our current infrastructure is that we use existing tools, built by excellent engineering teams at Mozilla. We use Taskcluster, our in-house CI system used to test and build Firefox a lot. In addition, we depend on our own Phabricator instance to review every Firefox patch, before it goes into a release.
Workflow
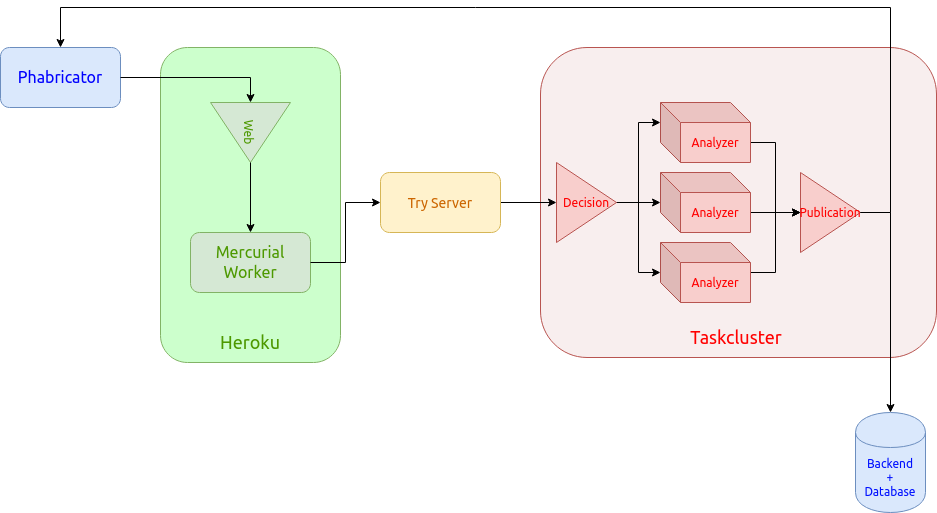
Each patch follows the same workflow:
- Phabricator notifies our web service that a new patch needs analysis.
- The web service applies the patch and its ancestor on a pre-cloned repository, using a pool of workers. (Remember the Firefox main repository is several gigabytes in size!)
- Once applied, that patch is pushed onto our Try server. The Try server is a Mercurial server used by Mozilla developers to trigger CI builds (to try a build).
- The Try server creates a set of code analysis tasks on Taskcluster: These tasks and their trigger rules are defined by the developers themselves in the Firefox source code.
- Each code analysis task produces a JSON payload listing all the potential defects found in the stack.
- Finally, a publication task analyzes, aggregates and filters all the issues. Then, it publishes the relevant ones on Phabricator and in our web service. In this way, developers can view them at any time, and be notified when an issue arises.
This workflow is usually executed in 12 to 15 minutes for most patches. Some patches that modify a lot of files may trigger a lot more analyzers and thus be slower to process.
You can find more information about the architecture in the project documentation.
Advantages
The main advantage of this approach: It allows us to use a lot of the existing tooling also available to developers on their own computers. (This is possible through use of the mach tool).
Another big win: we do not need to maintain our own analyzers, nor their dependencies. The analyzers are guaranteed to run continuously with the up to date versions, as they are defined in the Firefox code base, and maintained by people all over the world.
We currently support specific analyzers (clang-tidy, clang-format, rustfmt, mozlint, and more), as well as a generic format. This allows any Firefox developer to easily extend our platform capabilities.
What it looks like
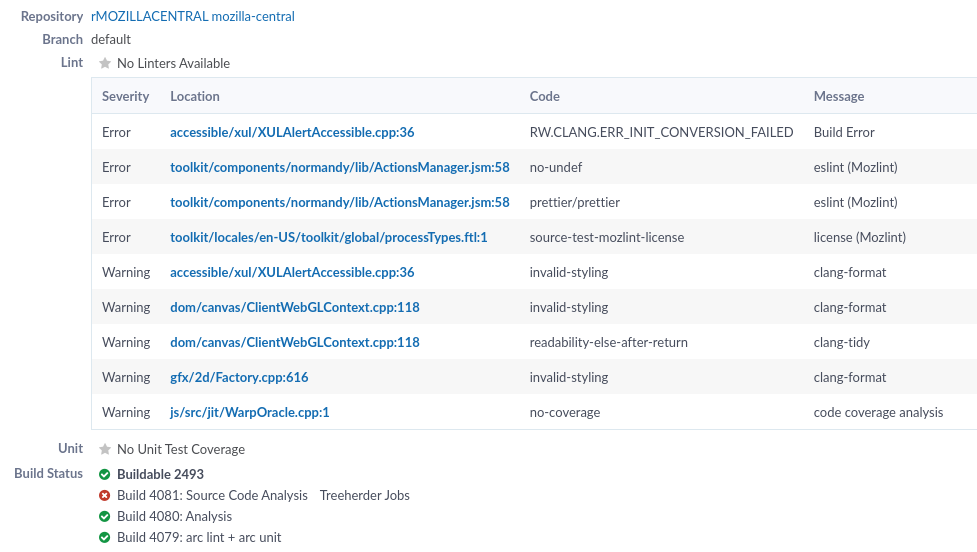
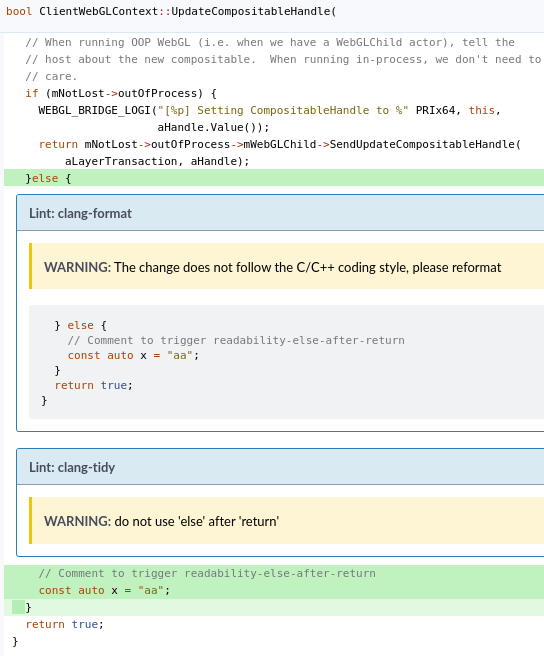
Here are a few screenshots of the issues on Phabricator. These are the workflow views that most Firefox developers at Mozilla are likely to see.
All issues found in a revision:
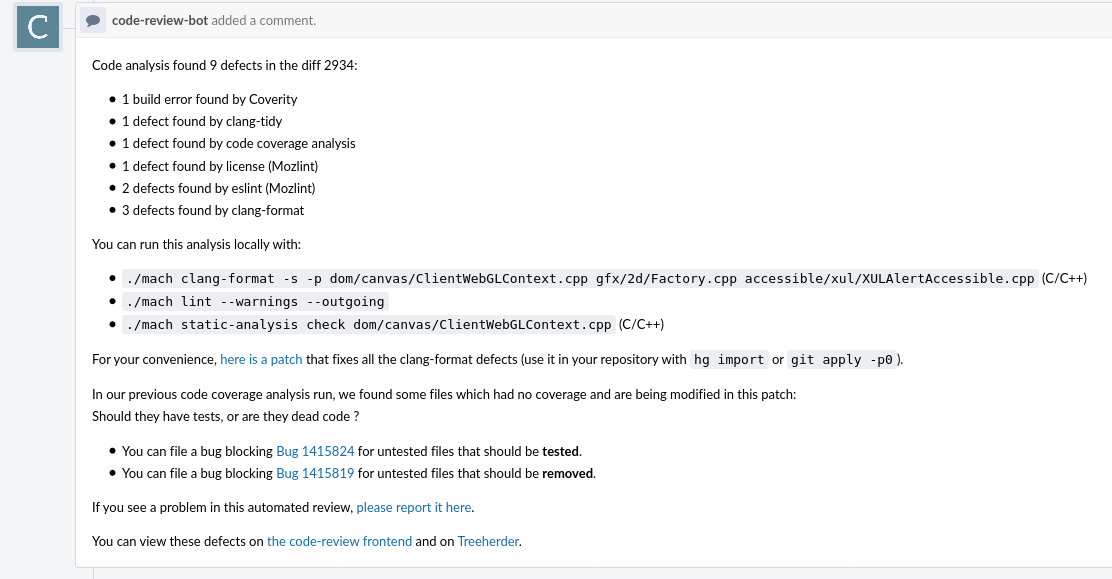
Summary comment listing:
Issues reported in the patch itself:
Future plans
This code quality workflow project has been built by a relatively small team over the last few years, reaching an excellent level of stability in the last year. We now are able to process every patch from Firefox developers in under 15 minutes on average.
We also support several other Mozilla projects with this platform: NSS (the main crypto library in Firefox), some CI internal projects, and we anticipate new ones in the future.
For a few months, thanks to our partnership with Ubisoft, we have been running an experiment, using Machine Learning to analyze patches at the review phase.The analysis submits a detailed report that assesses the risk of the patch, depending on a large number of factors (e.g. complexity, process metrics, etc.) In the future, this project might allow us to reduce the number of regressions in the Firefox codebase, and speed up reviews.
In the next quarters, we are aiming to bring fuzzing at the landing phase, by porting Mozilla fuzzers to Taskcluster (a huge effort by the fuzzing team!). We also want to report more issues without spamming developers, avoiding duplicates by only reporting issues that may be new when a revision is updated, by listing issues brought by a patch, or comparing with a previously known state.
Lastly, we want to enhance our reporting mechanisms, by taking advantage of a new email notification system developed by the Engineering Flow team. This could potentially refine the way issues are displayed in Phabricator, and extend our ability to comment and lint issues that we detect.
Bring on the patches. We expect them to keep coming with every new release of Firefox. But we’re proud of the code quality tools we’ve developed to support Mozilla engineers and contributors building a better Firefox.
How to participate in building Firefox
Want to get involved, or learn more about building Firefox? There are so many ways to get involved in building the technology that goes into our browser. The code review platform is also open source and available on Github, contributions are welcome.
About Bastien Abadie
Senior Software Engineer at Mozilla, maintainer of the Code Review Bot
More articles by Bastien Abadie…
7 comments