
This week marks the release of Firefox Developer Edition 49! This post covers some of the big changes that landed in this release.
Request stack traces in Network Monitor
The Network Monitor now has a new “Cause” column that shows how a given network request is initiated. The column shows the type of the request, includes a tooltip with the loading document, and, most importantly, if a JavaScript stack trace is available, you can see it in a popup bubble.
The JavaScript stack trace is most interesting for XHR requests, but is available also for any other request that is directly or indirectly initiated by a script, like when a script inserts a <script> or <img> element into the page.
This feature is useful if you want to figure out why and from where on the page a particular HTTP request is issued. (See bug 1134073.)

Animation performance info in Inspector
You can use the Inspector panel to investigate details of your CSS and DOM animations. In Firefox 49, you can now get detailed performance information for your animations. If an animation property cannot be run on the compositor (i.e., cannot be hardware-accelerated), it is underlined in the expanded animation view, and an associated tooltip explains what’s going on.
In the example below, the transform and width properties cannot be accelerated at the same time. With this new tool in Inspector, you can now spot under-performing animations and learn what changes you need to make to accelerate them.
Read David Baron’s blog post if you want to learn more about how animations are optimized in Gecko. (See bug 1254408 for more detail.)

Reorganized context menu in markup view
The Inspector has a context menu with many actions, which was becoming long and unwieldy. Contributor Moaaz Sidat reorganized the menu, dividing it into several sub-menus. (See bug 1211613.)

Other improvements in the Inspector Panel
Firefox 49 adds support for #rrggbbaa and #rgba syntax for color values. The Inspector in developer tools now supports this syntax, too. (See bug 1271191.)

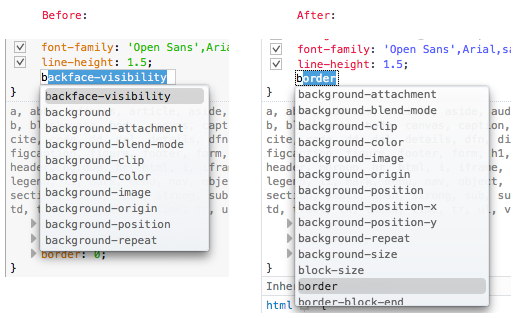
In the CSS rule editor, autocomplete now displays more possible properties, in a scrollable list. As a result, it’s much easier to find the value that is relevant to you, or learn about new CSS properties that you were not familar with previously. (See bug 1260419.)
In the markup view, self-closing tags like <br> are now displayed as <br></br> only if the doctype is XHTML. For normal HTML, the markup is now displayed in a more accurate and less verbose form. (See bug 820926.)
Links to MDN reference docs From Console JavaScript errors
When you see an unfamiliar error message in the Console, you no longer need to copy the message and search online for documentation. You can simply click on a direct link to the MDN reference page about the error that is a part of the message. Read a blog post by @floscholz and @mrrrgn to learn more about this feature and how you can contribute to make it better. (See bug 1179876.)

New color scheme for syntax highlighting
We thought our syntax highlighting colors were looking a little dated, so we changed them up in both the light- and dark-themed versions of Developer Edition Firefox. The new colors are optimized for accessibility: they have better contrast and are easier to distinguish in all situations.

Accessibility improvements
We’ve made important accessibility improvements throughout this release. Most developer tools UI elements now have a clearly visible focus indicator, the UI is navigable using the keyboard, and accessibility semantics in the Inspector panel were improved. (See bugs 1242694, 1242715, and 1242851.).
Other notable changes
In addition to the improvements above, we have polished various areas throughout the developer tools, in particular:
- The about:debugging page displays a warning when service workers are disabled, whether by private browsing mode or by a pref. (See bug 1266415.)
- Step by step, the Storage Inspector is becoming more editable. In this release, we are adding a context menu option to delete an IndexedDB database. (See bug 1205123.)
- Network Inspector now shows the exact number of bytes if the response size is smaller than 1KB. (See bug 1263945.)
- Pressing the ‘h’ key in the Inspector panel, which is a shortcut to hide the selected element, now also grays out the element markup. (See bug 1127572.)
Thanks to everyone who has contributed to this Developer Edition release! Grab a copy of the latest Developer Edition now and let us know what you think.
About Jarda Snajdr
Firefox contributor who enjoys learning about the browser internals and solving complex problems.
7 comments