Firefox Developer Edition 45 has improvements to DevTools that will help you track down memory usage, dig into CSS animations, and more. In this post we’ll cover some of these changes – be sure to download the latest Developer Edition to try them yourself.
CSS animation tool++
The animation tool has many additions:
- When you click on an animation in the timeline, you’ll now see a list of the animated properties plus keyframes which show you the change in values over time.
- If an animation is moving too fast for you to see what’s going on, you can now slow it down by changing the playback rate.
- Animations running on the compositor thread have a lightning bolt icon next to them. This means that they will remain smooth even if the rest of the page is slow.
Learn more about using the animation tool in the latest episode of Patrick Brosset’s screencast series: “Using the Dev Tools to understand CSS”.
Beyond the animation improvements, the inspector’s search tool was also improved. It now matches results from all markup in the page and subframes.
What’s eating your memory?
We’ve improved the way you can inspect memory usage and find what is consuming memory. With snapshot diffing, you can inspect changes in the heap contents since a previous snapshot. And with snapshot filtering, you can show only memory allocated in a certain file or function, or show only the objects of a specific [[class]] type.
Read more about the Memory Tool and documentation about how to get started with it. We’ve also put together a quick gif that walks through the diffing process.
A bit of polish
We’ve also been working on polish and bug fixes across the toolbox – here are some of the highlights.
Console
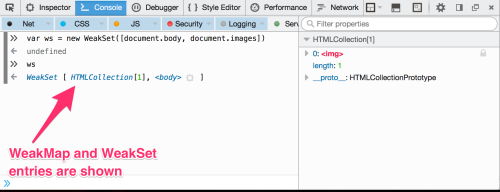
If you’re working with WeakMap and WeakSet objects, you can now see their entries in the web console.
Also, logs coming from service workers show up by default in controlled tabs. There is still a lot of work coming to improve the service worker debugging experience, follow this tracking bug for more.
Network monitor
- You’ll see markers showing when DOMContentLoaded and load events fire in the network timeline.
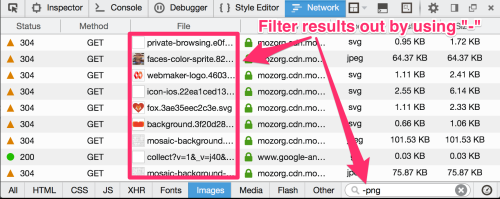
- You can now filter out filenames based on a string match. Just use “-” in front of the string, which is a handy way to narrow down a big list of requests.
And a big thanks to contributors Albert Juhé and Tim Nguyen for their help in making the netmonitor table UI match the rest of the toolbox.
There are a lot of improvements in this version so download it now — it’s free!
About Lin Clark
Lin works in Advanced Development at Mozilla, with a focus on Rust and WebAssembly.


2 comments