
RDP Inspector is a Firefox extension that intercepts the Remote Debugging Protocol (RDP) and allows inspection of all data sent and received.
This extension is useful for anyone who wants to extend native developer tools in Firefox by implementing new remotable features or for those who want to learn more about how built-in tools use the protocol internally to communicate with the backend debugger server.
Getting started
The latest RDP Inspector can be installed from addons.mozilla.org (you need to have at least Firefox 38 installed). The source code is also available.
You should see a new RDP Inspector button at the top-right corner of your browser window after installation.
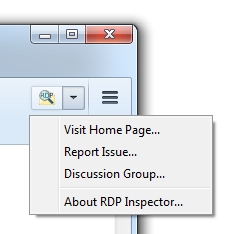
Clicking the button opens the RDP Inspector console window.
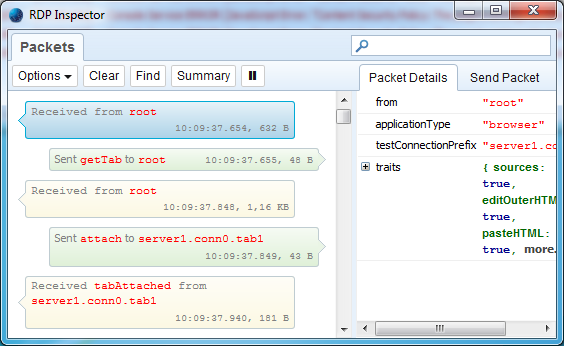
The console shows all packets transmitted over the wire. It also shows packet details within the right side panel.
The screenshot above shows also the very first packet received from the server (from the root, with applicationType="browser").
This is how the connection between the developer tools toolbox and the backend server is initiated.
Filtering Packets
The packet list can be long and you can filter it. For example, in order to see only getTab packets sent to the root actor you can filter the packet list by typing getTab into a box located at the top right corner of the console window.
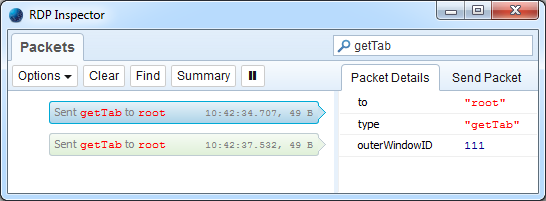
Tip: You can also press Ctrl+F and use the browser Find Bar to search within the packet list.
Summary Data
It’s sometimes useful to know how many packets or bytes are sent/received in total. This usually also helps to optimize protocol traffic and make new or existing features faster.
The console helps you get this summary info at at any time. All you need to do is press the Summary button in the toolbar.
The following screenshot shows a summary for the http://www.washingtonpost.com/ page load time with the Network panel selected (see the bottom of the packet list).
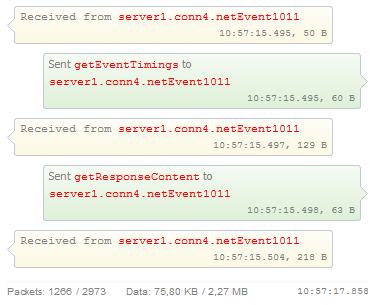
You can see that 1266 packets have been sent, 2973 packets received, 75,80 KB sent, and 2.27 MB of data received from the server.
Chatting with the server
It’s also possible to send test packets to the server backend. You can put together a new packet with your own properties, send it to the server, and get a response as if it were a packet send by the developer toolbox. All you need to do is select the Send Packet side panel, set some properties, and press the Send button.
In order to create a new packet property click on the New… (yellow) line at the top of the panel and type its name.
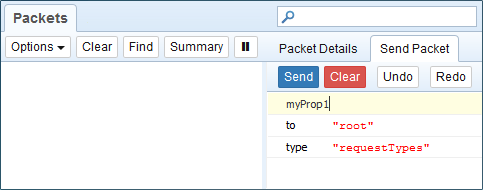
As soon as you press the Enter key, a new property is inserted at the end of the list.

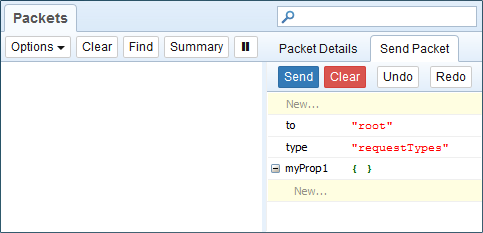
The default value is set to undefined and you can change it by clicking on the value text input box. Strings need to be inserted within quotes and new objects (JSON packet sub-tree) can be created by typing {} into the value input box.
When the packet is ready press the Send button and check out new packets displayed in the list.
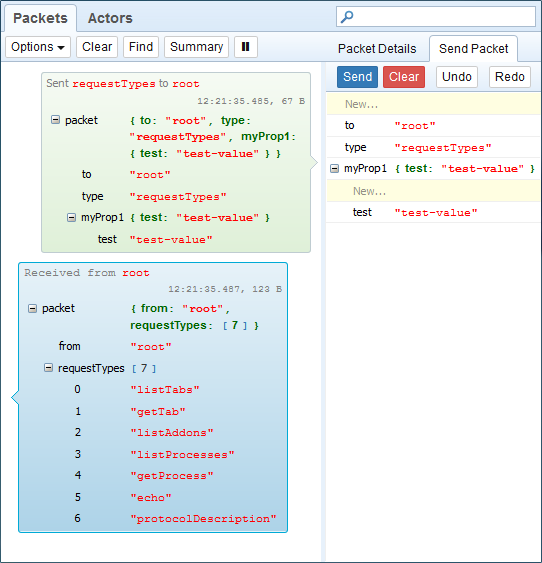
The screenshot above shows that our test property has been sent. You can also see the response from the debugger server.
Tip: You might want to set the Show Packet Details Inline option (see the Options button in the toolbar) and see all packet properties directly within the packet list. This way you don’t need to constantly switch between the Packet Details and Send Packet side panels.
Introspecting the protocol
There are cases when you want to know what services are available on the backend server and test them. These can be both native or custom (installed) backend APIs. The protocol supports the following packet types that can be used for dynamic introspection.
requestTypesSend to any actor to get the list of supported packet types (methods).protocolDescriptionSend to the root actor to get the list of all backend services (actors) and their methods
A response for requestType is already visible on the previous screenshot and you can see that protocolDescription is one of the packet types you can send to the root actor.
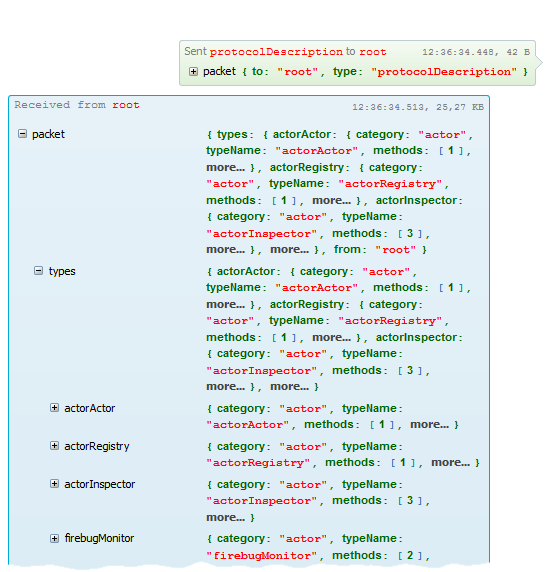
The next screenshot shows the response for the protocolDescription packet request.
Isn’t it great, you can chat with your protocol ;-)
Learn more about RDP Inspector on the
Learn more about the RDP Inspector over on the project wiki, and please help by filing any issues or bugs you discover. As always, we welcome your feedback.
Jan ‘Honza’ Odvarko
About Jan Honza Odvarko
Honza is working on Firefox Developer Tools
One comment