
While learning about and measuring what happens on phones, we’re learned a great deal around power consumption. Therefore we want to share some learnings and what have resulted in the FxOS Powertool!
Introducing the FxOS Powertool!
With the FxOS Powertool!, we can optimize apps for power consumption, but also verify and fix bugs related to that. It is a command line utility with a number of options:
usage: powertool [-h] -d {yocto,mozilla} [-p PATH] -u {tk,cli} [-f FILE]
                 [-o OUT] [-s SHOW]

Mozilla Powertool

optional arguments:
  -h, --help            show this help message and exit
  -d {yocto,mozilla}, --device {yocto,mozilla}
                        specify ammeter device to use
  -p PATH, --path PATH  specify path to ammeter device (e.g. /dev/ttyACM0)
  -u {tk,cli}, --ui {tk,cli}
                        specify which UI to use
  -f FILE, --file FILE  test run config file
  -o OUT, --out OUT     output data file
  -s SHOW, --show SHOW  name of the sample source to display
Get the code by cloning the repository:
$ git clone git://github.com/JonHylands/fxos-powertool
The FxOS Powertool! is written in Python and uses the Tkinter UI package and should be cross-platform. Then install the application and dependencies:
$ cd fxos-powertool
$ sudo python ./setup.py install
The next step is to create a test suite description file. The FxOS Powertool! uses the description file to know what tests you plan on running and it organizes the collected data under each test. A test suite description file looks like:
{
  "title": "My Tests",
  "tests": [
    "My first test",
    "My second test",
    "My third test"
  ]
}
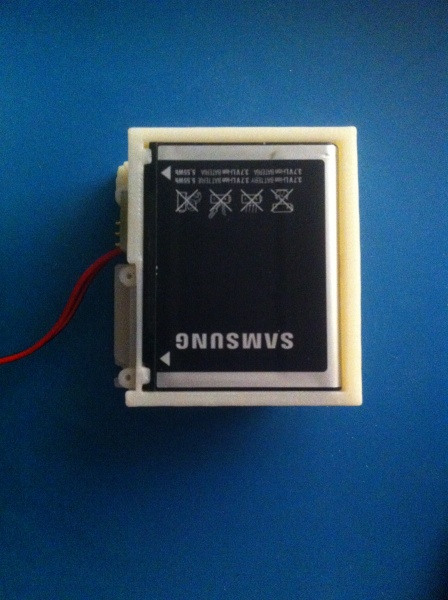
Building a battery harness
This is what you need:
- A digital USB ammeter, like the Yocto-Amp or building your own
- A battery harness. It’s an open hardware design consisting of a 3D printed part and a small circuit board for plugging in the ammeter. You can also build the harness yourself with the 3D printer and circuit board files needed. At this time, we have designs for:
- Alcatel OneTouch Fire
- Samsung Nexus S
- LG Nexus 4 – special instructions for assembling the harness
- Geeksphone Keon
- Huawei Ascend Y3000II
- ZTE Open
- A strong will to build something cool
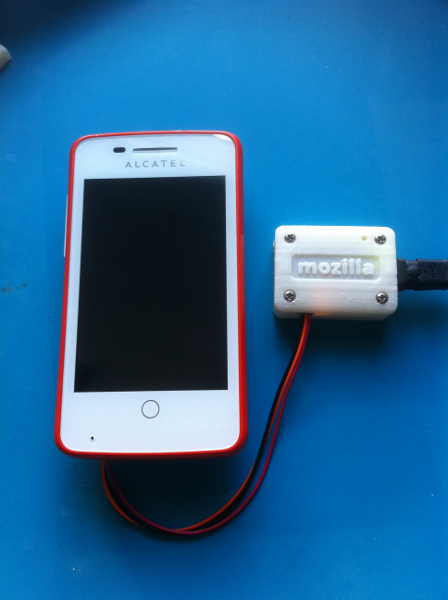
Next you need to set up your hardware:
1. Pull the battery from your FxOS device & place it in the battery harness
2. Put the battery harness into your device

3. Plug in your ammeter

Running FxOS Powertool!
Now you’re ready to start the FxOS Powertool! and begin collecting data.
With the FxOS Powertool!, you can save the collected data in two different formats: JSON and comma separated values. The format is determined from the file extension of the file specified in the --out option. For example:
- My test suite description file is called
mytests.json - I’m using a Yoctopuce ammeter
- I want the Tk GUI to show the current consumption graph
- I want the collected data to be saved in
.csvfiles
Then my command line would look like this:
$ powertool -d yocto -p /dev/ttyUSB0 -u tk -s current -f mytests.json -o mytests.csv
If I were to use the Mozilla ammeter instead, with the same test parameters:
$ powertool -d mozilla -p /dev/ttyACM0 -u tk -s current -f mytests.json -o mytests.csv
The Tk GUI should start up and the title of your first test will be shown in the title bar of the app:

To control the collection of data and navigate through the tests, FxOS Powertool! uses keyboard shortcuts. With the GUI open, you can start/stop collecting data for the currently selected test by hitting the space bar. The first time you hit the spacebar, data collection begins; to stop data collection, just hit the spacebar again. Each data collection run will be recorded as a row of data in the output files:

You can repeat data runs for a given test as many times as you like, navigate to another test or tests, do data runs for those test, then come back to a previous test and continue doing those data runs. No data will be lost in the FxOS Powertool! will not lose any data and it will, for each test, aggregate the data runs into the correct data files. Use the ‘L’ and ‘H’ keys on the keyboard for navigating between tests. ‘L’ moves to the next test in the list, ‘H’ moves to the previous test.

When you have collected all of your test data, the data files are written to disk when you quit the application: do so by either clicking on the close window button in the title bar or pressing the ‘Q’ button on the keyboard. In this example, the data was written out in CSV format by giving it “mytests.csv” as the –out paramter value. The application will create a “mytests” directory and then write out a CSV file for each test with all of the data gathered for the test.

Like we’ve gone through in this article, the FxOS Powertool! will do some very basic statistics calculations for you. Along with the raw data, it also calculates the minimum and maximum value, mean, and standard deviation for all of the data collected for the test.
About Jonathan Hylands
I'm a software developer/maker working on the performance team for FirefoxOS at Mozilla. I design and build hardware and software that allows FirefoxOS developers to measure power consumption on their phones. I build robots as a hobby.
More articles by Jonathan Hylands…
About Robert Nyman [Editor emeritus]
Technical Evangelist & Editor of Mozilla Hacks. Gives talks & blogs about HTML5, JavaScript & the Open Web. Robert is a strong believer in HTML5 and the Open Web and has been working since 1999 with Front End development for the web - in Sweden and in New York City. He regularly also blogs at http://robertnyman.com and loves to travel and meet people.
One comment