Box model highlighter, Web Console improvements, Firefox OS HUD + more – Firefox Developer Tools Episode 30

Firefox 30 was just uplifted to the Aurora release channel, so let’s take a look at the most important DevTools changes in this release.

Inspector

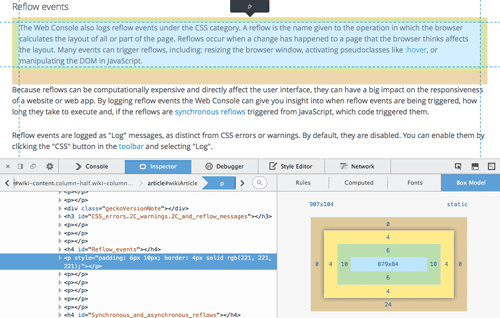
One of our most requested features has been to highlight box model regions of elements on the page. We are happy to report that this feature has landed in Firefox 30. One of the great things is that the colors of the box model highlighter match the box model diagram found in the right pane of the inspector more clearly than before.

Check out the inspector documentation to read more about the new functionality, or just see the screenshot and short video below:

Inspector box model highlighter

There is a new font family tooltip to the CSS rule view. Hover over a font-family value to see an inline preview of the font. (development notes)

Inspector font family preview

Web Console

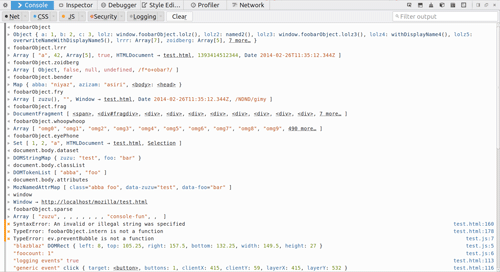
There are some big improvements in the web console to help view and navigate output.

Sample console output

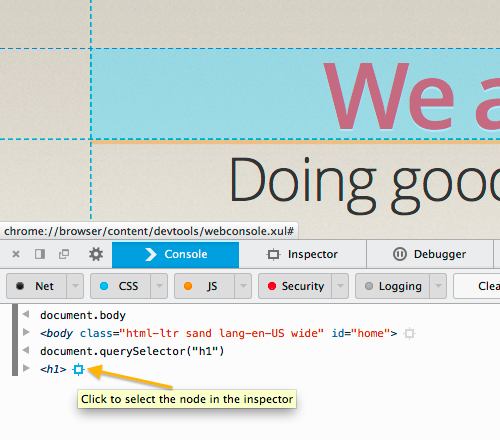
Highlight and jump to nodes from console

Running the cd() command in the console switches the scope between iframes. Read more in the cd command documentation. (development notes)
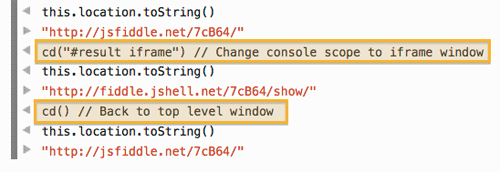
Console cd() command

You can read more from Mihai about the ongoing changes to the web console. He has also been documenting the web console API for extension authors.

Firefox OS

The network monitor is now working with Firefox OS. (development notes)

There is now memory tracking (development notes) and jank tracking (development notes) in the Firefox OS Developer HUD. You can read much more about jank (aka “event loop lag”) in Paul’s Firefox OS: tracking reflows and event loop lags.

Firefox OS Developer HUD

Network Monitor

The Network Monitor has a new look to go along with some new features:

  • The design of the network timeline has been updated, which has actually improved scroll performance on the panel. (development notes)
  • Hovering over a request with an image response now shows a popup with the image. (development notes)
  • Network requests with an image response now display a thumbnail near the file name. (development notes)
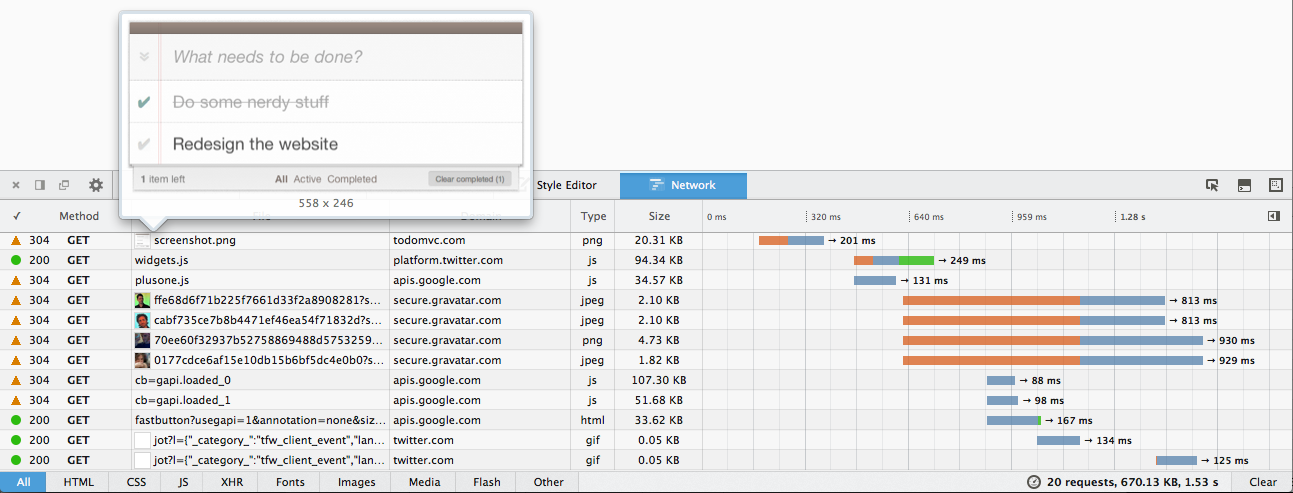
Network Monitor Timeline UI

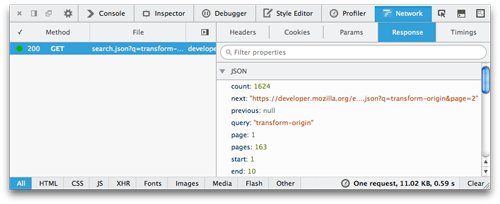
Network requests with a JSON-like response will show an object preview, even if the response type is plain text. (development notes)

JSON Response in Network Monitor

Toolbox

There is new behavior for console shortcut key (cmd+alt+k or ctrl+shift+k). It now focuses the input line in web console at all times, opening the toolbox if necessary but never closing it. There are more details about this change on robcee’s blog. (development notes)

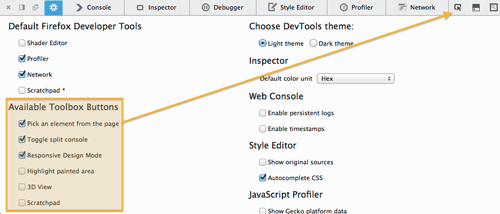
To save some space on the top toolbar, there are now options to hide command buttons, like Scratchpad. The only buttons enabled by default now are Inspect Element, Split Console, and Responsive Mode. More information about this change on the devtools mailing list. (development notes). To enable Scratchpad, Paint Flashing, or Tilt, just click on the checkbox in the options panel.

Enabling Command Buttons on Toolbar

We would like to give a special thanks to all 46 people who contributed patches to DevTools this release! Here is a list of all DevTools bugs resolved for Firefox 30.

Do you have feedback, bug reports, feature requests, or questions? As always, you can comment here or get in touch with the team at @FirefoxDevTools.

About Brian Grinstead

More articles by Brian Grinstead…

About Robert Nyman [Editor emeritus]

Technical Evangelist & Editor of Mozilla Hacks. Gives talks & blogs about HTML5, JavaScript & the Open Web. Robert is a strong believer in HTML5 and the Open Web and has been working since 1999 with Front End development for the web - in Sweden and in New York City. He regularly also blogs at http://robertnyman.com and loves to travel and meet people.

More articles by Robert Nyman [Editor emeritus]…


50 comments

  1. Ethan

    This is all absolutely wonderful, folks. Thanks so much for the update, and all the hard work!

    One question: will it be possible to create new selectors (and edit existing ones) in the Inspector? The style editor is wonderful, but feels a bit removed from the inspection workflow.

    Thanks again! Love all this activity.

    March 25th, 2014 at 09:44

    1. Patrick

      Yes this is definitely on the radar. I don’t know of any existing bug on file though, but we’re aiming at synchronizing the inspector’s css rule-view and the style editor in all sorts of way.

      March 25th, 2014 at 09:48

      1. Brian Grinstead

        We do have a bug opened for this: https://bugzilla.mozilla.org/show_bug.cgi?id=966896. Making sure that the rule view and style editor are syncing is a first step in this case, but adding a UI for this would be handy.

        March 25th, 2014 at 10:33

      2. Luke

        There is this tweak I made some time ago, for the right click, new-rule feature: https://addons.mozilla.org/en-US/firefox/addon/devtools-tweaks/

        but the right click, new rule feature it adds does the same as adding a new style in the Style Editor tab.

        Editing css selectors directly from the inspector would be great :)

        March 26th, 2014 at 17:45

    2. Robert Nyman [Editor]

      Thanks for the kind words, Ethan – means a lot coming from you!

      March 25th, 2014 at 10:27

  2. Hervé Renault (@HerveRenault)

    This is great! Thank you, Mozilla.
    I blogged about the highlighter a few days ago in French :
    http://mozillazine-fr.org/bonne-nouvelle-pour-les-developpeurs-web-dans-firefox-nightly/

    March 25th, 2014 at 10:00

    1. Robert Nyman [Editor]

      Thanks for sharing Hervé!

      March 25th, 2014 at 10:27

  3. Jeff

    any chance the console command line can be integrated with the script debugger? Often while stepping through code, its useful to manually type commands in the current context to test and try thing.

    March 25th, 2014 at 10:08

    1. Brian Grinstead

      The console scope actually does get updated when stopped in a breakpoint. So if you press escape or click the split console button to see it in line with the debugger: https://developer.mozilla.org/en-US/docs/Tools/Web_Console#The_split_console

      March 25th, 2014 at 10:11

  4. starwed

    Sometimes I accidentally make my console.log commands a bit too verbose, and it somewhat freezes the console. You can stop execution from the debug tab, but when the console is frozen switching actually takes a pretty long time!

    It would be nice to have the simple pause functionality from every panel. (Maybe this already exists?)

    March 25th, 2014 at 10:23

    1. Brian Grinstead

      Don’t think there is a way to pause functionality from the console panel, but if you had an example set of log statements that cause freezing or other performance issues in the console we’d be happy to take a look.

      If you could come up with a basic test case showing the problem you could file a bug here in the Developer Tools: Console component and we’ll take a look: https://bugzilla.mozilla.org/enter_bug.cgi?product=Firefox.

      March 25th, 2014 at 11:31

  5. somedude

    I still like firebug better…

    March 25th, 2014 at 12:27

    1. Robert Nyman [Editor]

      Thanks for your comment. If you were to outline what you like in Firebug that you miss in Developer Tools, that would help us much better.

      March 25th, 2014 at 12:40

  6. Nate

    The colors used for the box model stuff is really horrible for someone who is colorblind. Took me a few seconds of moving my head around at different angles to even see there were more than two colors.

    March 25th, 2014 at 12:46

    1. Brian Grinstead

      Right now there is opacity of .4 on the colors being overlaid on the page. Do you think that if we made the overlay a bit more opaque that could help? The base colors were chosen to match the same colors being used in other devtools so that it would be familiar to people.

      March 25th, 2014 at 12:54

      1. Srap

        Maybe add some patterns alongside the colors, something like: padding is horizontal striped, margin is vertical striped, X is dotted, etc.

        March 26th, 2014 at 02:29

    2. Brian Grinstead

      OK, I’m working on a bug to improve the visibility of the box model regions on the page: https://bugzilla.mozilla.org/show_bug.cgi?id=989053. Please comment there if you have feedback.

      April 2nd, 2014 at 09:22

  7. Jaroslav Matura

    To be entirely honest, I don’t like the new Dev Tools look, and especially the colors. The new features are amazing and I totally dig them, but their “coat” is ugly compared to the currently stable Dev Tools (FF v28).

    Also, I aplaud for the option to show/hide some buttons, but having an option to move the Element Selection tool back to the left where it used to be would be wonderful. I just don’t like having the controls on the right. It doesn’t feel…right.

    March 25th, 2014 at 16:15

    1. Brian Grinstead

      By the way, if you are not a fan of lighter color scheme then you can always flip over to the dark theme in the options panel

      March 25th, 2014 at 18:25

  8. Eric

    Awesome work.. in the network monitor i’d love to see a quick way to see resources loaded/not loaded using https (maybe a padlock?)… that would be hugely useful while debugging https errors saying that some resources are loaded over http instead of https

    March 25th, 2014 at 17:10

    1. Jeff Griffiths

      Interesting idea! I’ve logged this bug to capture it, feel free to follow along: https://bugzilla.mozilla.org/show_bug.cgi?id=988121

      March 26th, 2014 at 10:45

  9. Alex

    These are great additions! Much appreciated!

    Just one small bug to report: with the latest update closing the Developer Tools resets document’s scrollTop to 0, which can be kind of irritating…

    March 25th, 2014 at 17:17

    1. Brian Grinstead

      Thanks! I’ve filed a bug to get this issue resolved: https://bugzilla.mozilla.org/show_bug.cgi?id=988102

      March 25th, 2014 at 18:16

  10. Mike

    Thanks for all the improvements :)

    March 25th, 2014 at 20:05

  11. Luke Michaels

    Excellent work guys, thanks :-)

    March 25th, 2014 at 22:46

  12. mork

    The highlighting of the box model was the reason I did my CSS work in Chrome but now I can do it all in Nightly. Thanks Mozilla. :)

    March 26th, 2014 at 04:12

  13. Niclas

    One thing that still bothers me is the size of the network request view. Is it still limited to a fixed maximum width? Sometimes I need to inspect the request headers or even the response body and it never fits into the tiny view.

    March 26th, 2014 at 07:57

    1. Brian Grinstead

      This was actually also fixed in this release, in bug: https://bugzilla.mozilla.org/show_bug.cgi?id=899727. So if you grab Aurora there should no longer be the maximum width.

      March 26th, 2014 at 08:10

  14. Mick

    This is absolutely useless. Firefox team lost a connection to reality.

    The Inspector, Network monitor, the Toolbox in the browser code – who in the earth need it? Not users, no. Developers only, you’d answer. Will developers change FireBug to that Inspector? Unlikely. Why waste your time then? Why bloat the code? Why make the already slow browser even slower?

    The Firefox OS – guy, get back to Earth. You closed Firefox for Metro, because only 1,000 of users worldwide “tested” it daily (note: not USED, only TESTED). And you are speaking of “blah-blah mobile OS”, which market share is exactly how much different from 0%?

    Get back to your users. Answer the QUESTION # 1, which users ask back on the topic “Chrome vs. FireFox” – “When we see each tab in separate process”.

    Until you actually “face” your users, FireFox will remain “that nice thing of the past”.

    PS. Wondering, is “keep FireFox behind Chrome” the main part of Google-Mozilla sponsorship?

    March 28th, 2014 at 09:56

    1. Jeff Griffiths

      I’ll address your questions that actually relate to this article, I have no comment on the rest:

      * we are very careful not to load any tools code until a developer opens the toolbox, and any cases where this is not true are treated as bugs. Your assertion that built-in tools are bad for regular users is based on some false assumptions.

      * multi-process Firefox is being actively worked on again ( it was shelved for a while ) and can be tested in nightly. It’s unclear to me when we’ll ship it as there are a number of issues to resolve eg add-on compatibility, but the security and performance benefits seem to be worth it.

      * we’ve specifically asked Firebug users for feedback on why they don’t use our tools, and this release is the culmination of a lot of work over the last year to fill those gaps. At this point I don’t see many reasons not to switch ( extensions perhaps but we’re working on that as well ) but I am very interested in suggestions or bugs from users that do still see gaps.

      Let me know if you have any additional (hopefully constructive) feedback.

      March 28th, 2014 at 10:22

      1. Mick

        Thanks Jeff, appreciate your follow up.

        Glad you are addressing the bloating the RAM with loading code on demand. I do respect that aspect.

        Don’t get me wrong – I still think the developers tools in the browser code are the wrong idea and a waste of your resources, when more critical changes are on much higher demand.

        I was rather shocked to learn that such tools appeared in FireFox, so obvious it was for me that it was a wrong direction. Developers use FireBug. Do you want to scatter your efforts in this competition?

        I do respect your work – it’s impressive. But only a shadow of what developers do with FireBug.

        If you want to beat dev.tools of competing browsers – contribute to FireBug. It’s already superior to them.

        PS. A bit of trivia for you – when an IT guy is recommending a browser to moms and grandmoms, who run older standard PCs, which one he is going install?

        PPS. I am a FireFox user *now*, but not because it’s faster than Chrome.

        Sorry to spoil your day, but I really wish you best, and I want you to look the truth into the eyes.

        Sincerely,
        Mick

        March 29th, 2014 at 13:45

        1. Robert Nyman [Editor]

          Thanks for your feedback. On the topic of Firebug and the relation to Developer Tools, we’ve elaborated more on that in Firefox Developer Tools and Firebug.

          In short, we’ve been exploring and evaluating different options carefully, and have decided that this is the most optimal and efficient path forward to cater to the needs of most developers.

          I think another important thing to consider when it comes to features and support is that it’s not an either/or decision – just because one feature/product (e,g, Developer Tools) has been chosen, that means that no work goes into other areas (like web browser performance).

          There is a multitude of efforts going on at the same time, and we are doing our very best to make Firefox a better product, both for developers and for users.

          Thanks for using Firefox, and I hope we can keep improving it for you.

          March 31st, 2014 at 02:35

        2. Jeff Griffiths

          You said: “I do respect your work – it’s impressive. But only a shadow of what developers do with FireBug.”

          Can you be more specific about that?

          March 31st, 2014 at 09:25

  15. Hervé Renault

    “Each tab in a separate process” ? As a user, I’m not sure I want to see Firefox eat as much memory as Chrome…

    March 28th, 2014 at 10:19

    1. Jeff Griffiths

      Actually I think the initial implementation is window-per-process, with Firefox’s privileged code being in a separate parent process as well. We’re obviously very aware of the memory usage issue ( for example the Memshrink project has made amazing gains over the last few years, and we want to preserve our reputation of being, well, slimmer ).

      March 28th, 2014 at 10:24

      1. Hervé Renault

        Thanks Jeff. I love slim dinosaurs ;-)

        March 28th, 2014 at 10:27

  16. goliatone

    This is great! I started using FF for development mainly because of FireBug and then kept it as my main browser. When FF entered the fast release cycle, a lot of the extension I used broke and the overall quality of my experience dropped- performance seemed bad.
    At the same time Chrome gave its dev tools a boost and performance was also better. I made the switch…
    Currently Chrome’s performance is getting on my nerves, and I’m not totally sold to Chrome’s dev tools. FireFox’s dev tools are almost at the point were im ready to switch back :)
    Kudos for the amazing work

    March 30th, 2014 at 20:18

    1. Robert Nyman [Editor]

      Thanks for the kind words!

      March 31st, 2014 at 02:37

  17. Jeff

    As a long-time firebug user, a few comments:
    1 – the whole screen flashes blue after page load as the Inspector highlights ‘body’. This is exceptionally annoying. I know its kind of a nit, but its nearly a deal-breaker.
    2 – the Element Selector should be on the left when the tools are docked on the right. its the most common button pressed.
    3 – The box model display is nice, but it would be even better if you could make changes directly there. Meaning, put the cursor in the top margin number and either type in a new value, or use up/down arrows to change.
    4 – In the Box Model, it would be cool if as you selected the outer items it showed the total width (i.e. width + padding + margin) summed up together as a quick reference.
    5 – it took me forever to find ‘inline javascript’ in the debugger. since the inline script is just the url it will sort to a different location each time. it would be handy to have it consistently at the top.

    otherwise, the tools are great. its the first time i’ve considered giving up firebug, which is huge!

    Thanks!

    March 31st, 2014 at 08:19

    1. Jeff

      I forgot one more:
      6 – in the Rules section of Inspector, while changing a value, it would be very helpful to use the arrow keys to cycle through possible options. i.e. for display:, cycle through inline, inline-block, block, etc etc. without having to type each value. firebug does this and its very helpful.

      Thanks!

      March 31st, 2014 at 09:04

      1. Jeff Griffiths

        This is excellent feedback, I really appreciate it!

        March 31st, 2014 at 09:26

    2. Dane MacMillan

      Hi, Jeff

      I filed a bug for #1 a couple weeks back:

      https://bugzilla.mozilla.org/show_bug.cgi?id=984848

      April 1st, 2014 at 07:57

      1. Jeff Griffiths

        Excellent, thank you!

        April 1st, 2014 at 13:25

  18. Carolina

    Great post, indeed the web console improvements to help view and navigate output are important. The previous highlights where difficult to identify and see. Also support from the console is very good.

    April 1st, 2014 at 17:15

  19. Tim

    Great upgrades! Finally start using these dev tools now instead of firefug.
    Still a few minor complains. Don`t know sure if this is the right place, but I`ll post them anyway.

    Can you please make the ‘expand’ arrows for certain css rules optional? Now there are always these small grey arrows in front of padding, margin and background for example to expand the field and show all the option over multiple rules.

    I personally will never use this, and I don`t think many people will. It actually really bugs me, because I think it only clutters the interface. Can you add the option to remove these arrows in the toolbox opntions screen?

    Also I think the lineheight of the rules can be decreased by at least 2 or 3px. That`ll create a better overview. Maybe this can be adjustable too?

    April 2nd, 2014 at 11:47

  20. aheu

    Good!
    God! But, I’am blind web programer using screen reader. Firefox devtools not access the webconsole output area, etc. Firefox screen reader to read the devtools well I hope I’d improve. Thanks!

    April 2nd, 2014 at 17:54

    1. Mihai Sucan

      We have a few bug reports about the accessibility issues with our devtools. We will work on fixing these bugs as soon as possible. Thank you for testing and reporting the problem!

      April 3rd, 2014 at 04:39

  21. opo

    Don’t know why or how the font on my Firefox DevTools is so incredible small. I don’t see where from should I set to a normal value. Right now they are like 4-5px making the work with the scratchpad a headake.
    Thanks
    ( I use linux ( manjaro + xfce ) if it has any relevance )

    April 6th, 2014 at 07:44

    1. Mihai Sucan

      Sounds like a known bug. See https://bugzilla.mozilla.org/show_bug.cgi?id=760825

      April 7th, 2014 at 08:57

  22. Hubert

    Guys, would be great if it would be possible to copy the content of Network / Response and Network / Params. Just right click and “copy all” will do. Waiting for your response, perhaps you can add it to nightly builds – I would download it immediately (for the first time), it’s that important/useful for me. Now I either have to make printscreens, or re-type them manually :(

    April 22nd, 2014 at 03:06

Comments are closed for this article.