Split console, pretty-print minified JS and more – Firefox Developer Tools Episode 28

Just in time for the holidays, the Firefox Developer Tools teams has some excellent new surprises for you to enjoy as you hack on holiday projects! It’s a pretty long list, so let’s get started.

App Manager

The App Manager continues to be a priority for the Devtools team and with Firefox 28, in addition to many minor fixes and improvements the team has added two new major features to assist in mobile development. These two features consist of an additional manifest editor and an embedded toolbox.

The Manifest Editor allows a developer to edit their app manifest directly. Using this editor you can add, edit, or delete fields in your app’s manifest.webapp and save them back to disk. This feature provides the developer an integrated experience, as the user never has to leave the tools while debugging and improving an application.

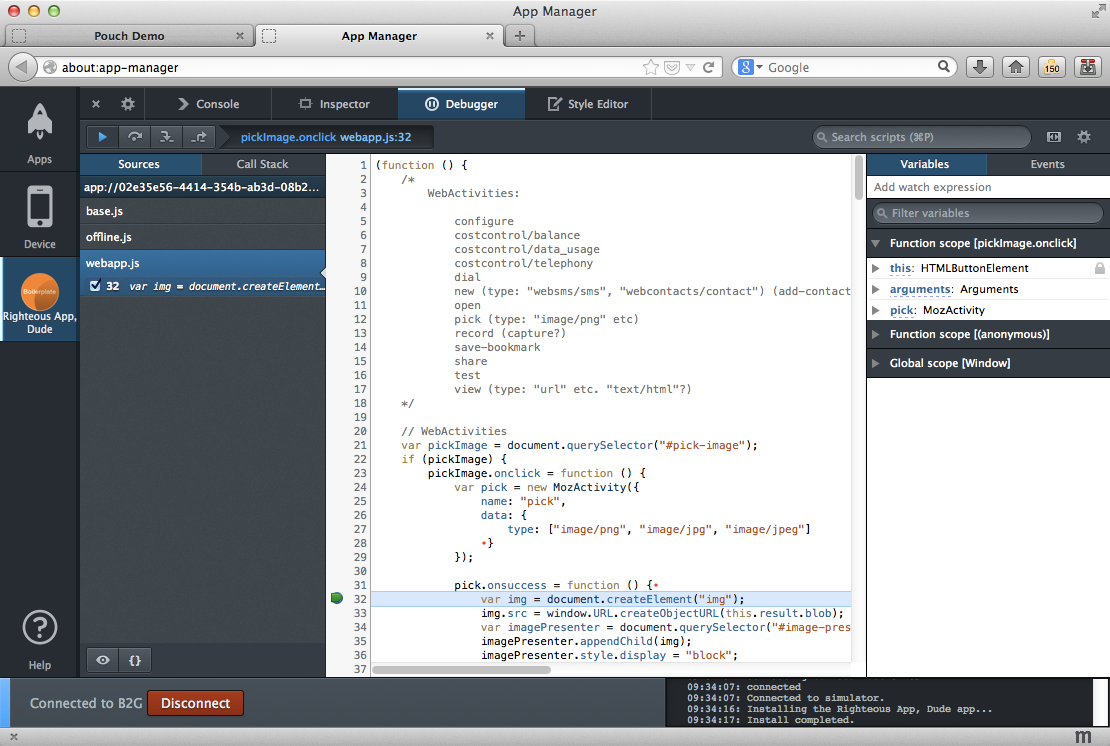
Also new to the App Manager is the embedded toolbox. Now when you debug your app (either using the Simulator or on device) the toolbox will be opened in the App Manager in a separate vertical ‘tab’ that is easily distinguished by the app’s icon:

Web Console

The biggest change in the Web Console is a feature we call ‘split console’; the web console can now be summoned from any other tool. Using split console mode is easy – if you’re working with any other tool and need access to the console, simply hit the Escape key or click on the button to toggle the split console, as you can see in this short screencast:

This isn’t the only improvement to the console though. In addition to split console we’ve also made the following changes:

  • CSS warnings are off by default – CSS warnings can often add hundreds of messages to the console as a page loads.
  • The console will now offer autocomplete suggestions for the current scope the debugger is in.
  • Message timestamps can be toggled on/off (the default is off)
  • console.exception() and console.assert() have been added to the console api.
  • We added a dark theme for the console

Debugger

In the debugger we’ve added two key features that developers have been asking for. First off we’ve added the ability to pretty-print minified JS files:

This feature is particularly handy if you minify your JavaScript or need to step through a minified library served from a remote site – just click on the minification button (picture above) to get a much more nicely formatted version of the file.

In addition to this we’ve added a feature to the debugger that allows you to inspect the value of a variable while debugging. For any variable, simply hover over it or click on it to bring up a pop-up that displays the current value:

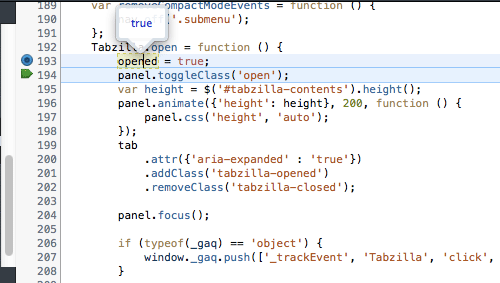
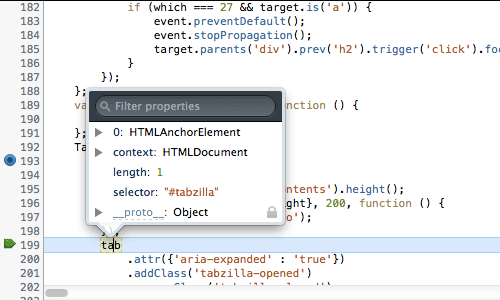
The pop-up allows you to inspect not only simple types like the boolean picture above, but also objects and DOM nodes:

Inspector

Following along from the addition of various tooltips to the Inspector in Firefox 27, we’ve added some additional features in the inspector:

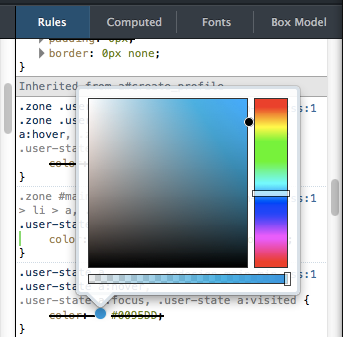
  • A Color picker tooltip in the rule view
  • We updated style the style of tooltips to better match the dark and light themes
  • The display timeout for tooltips was tuned based on your feedback

Here’s a screenshot to give you an idea what the color-picker tooltip looks like:

Wrapping up

That’s a huge list, but there were a couple of additional changes I’d like to call out as well:

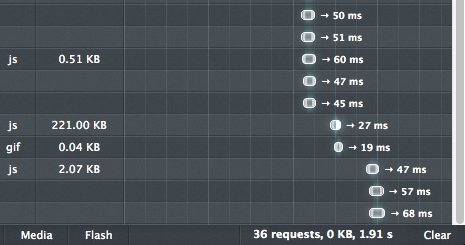
  • The Network Monitor now has a clear button, which should be of particular use to developers creating apps that make heavy use of web APIs:

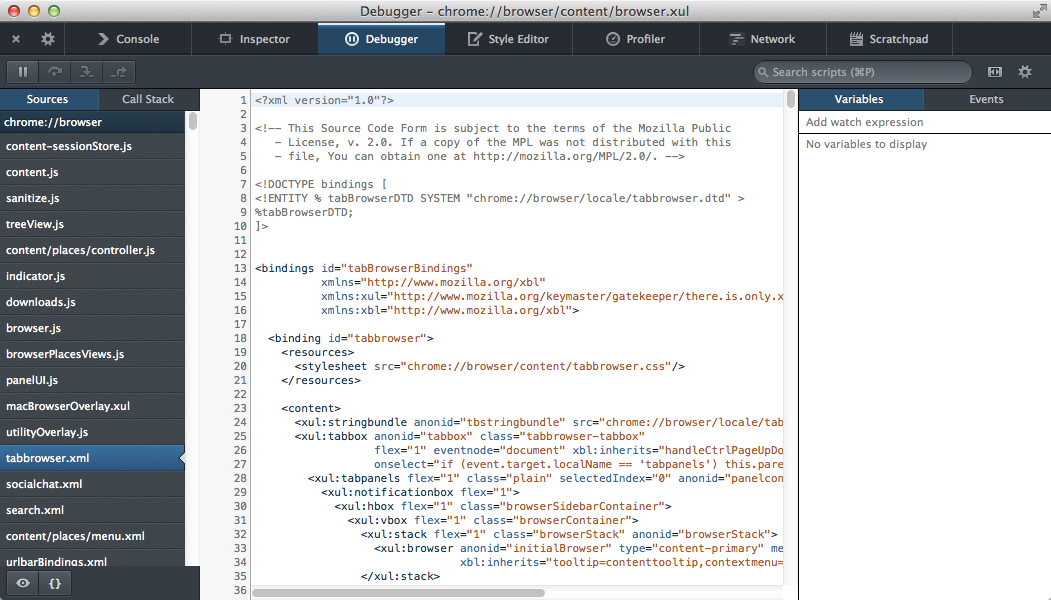
  • As a bonus for Add-on or Platform hackers, we’ve expanded the functionality of the Browser Debugger and re-named it the Browser Toolbox. When you open the toolbox you’ll see a full range of tools including not only the debugger but also the Console, Inspector, Style Editor, Profiler, Network Monitor and Scratchpad:

About Robert Nyman [Editor emeritus]

Technical Evangelist & Editor of Mozilla Hacks. Gives talks & blogs about HTML5, JavaScript & the Open Web. Robert is a strong believer in HTML5 and the Open Web and has been working since 1999 with Front End development for the web - in Sweden and in New York City. He regularly also blogs at http://robertnyman.com and loves to travel and meet people.

More articles by Robert Nyman [Editor emeritus]…


16 comments

  1. Barry van Oudtshoorn

    Fantastic to see the Firefox devtools moving forwards in leaps and bounds. I’m particularly happy to see the “Clear” button on the network panel — this will make it much easier to focus on just what I’m interested in. Great stuff.

    December 17th, 2013 at 17:18

  2. ilyas

    Pretty print when prompted for compressed js? (autodecompress minimized js)

    December 18th, 2013 at 00:28

    1. ilyas

      I see this now? it’s best? thanks

      December 18th, 2013 at 10:20

      1. Nick Fitzgerald

        We do not automatically pretty print minified JS yet. Follow along at https://bugzilla.mozilla.org/show_bug.cgi?id=913665

        December 18th, 2013 at 15:07

  3. Abhinav jagtap

    This is to gooood.

    December 18th, 2013 at 04:27

  4. Bryan

    Looks great! Keep up the good work.

    December 18th, 2013 at 07:43

    1. Robert Nyman [Editor]

      Thank you!

      December 18th, 2013 at 07:46

  5. Steve

    I am using Mozilla since long ago, and love the interface and the way its providing the more developer tools options easy to do online edits and one can find the bugs etc..

    I was previously using firebug now I think its time to make use of firefox developers tools, I love the responsive design tool of mozilla…

    December 18th, 2013 at 08:32

    1. Robert Nyman [Editor]

      Thanks, good to hear!

      December 19th, 2013 at 06:41

  6. Axel Rauschmayer

    “Split console” is a great idea. Would love to have that feature for Scratchpad, too (possibly even shown by default).

    December 18th, 2013 at 11:35

    1. Nick Fitzgerald

      This feature request pops up from time to time. I don’t feel strongly one way or the other, but the traditional rationale against it has been that it isn’t needed because you can type whatever you would in the console anyways and display/inspect it right in the scratchpad.

      If your goal is to quickly and easily find the value of vars / props, I think this bug might be better suited to your goals: https://bugzilla.mozilla.org/show_bug.cgi?id=936666

      Which is kind of related to this bug (although we’re starting to sidetrack here): https://bugzilla.mozilla.org/show_bug.cgi?id=922812http://fitzgeraldnick.com/weblog/52/

      But actually, I’m just really excited about that and think it is a huge prototyping productivity boon, but is a little hard to explain.

      Anyways, if you think that your use case isn’t covered well by that other bug or just typing what you want directly into the scratchpad, please file a feature request explaining why here: https://bugzilla.mozilla.org/enter_bug.cgi?product=Firefox&component=Developer%20Tools%3A%20Scratchpad

      December 18th, 2013 at 15:47

  7. Louis-Rémi

    One thing I still miss from Firebug: in the inspector, having the ability to right click on a DOM to inspect its properties. Currently I have to switch to the console tab and type “$0” there, which requires extra-steps and isn’t very discoverable.

    December 19th, 2013 at 01:18

    1. Panos Astithas

      We should hopefully start working on that soon. Follow this bug for updates:

      https://bugzilla.mozilla.org/show_bug.cgi?id=704094

      December 19th, 2013 at 04:15

  8. Ken Saunders

    Just curious and of course no big deal, but is the options icon meant to be a universal options icon?
    Toolbox Options and Debugger Options uses the same icon.

    Thanks for the team’s continuing additions and improvements to the Dev tools.

    December 19th, 2013 at 07:34

    1. Panos Astithas

      Debugger options came first, but we plan to merge them into the global options panel:

      https://bugzilla.mozilla.org/show_bug.cgi?id=879408

      December 19th, 2013 at 07:43

  9. Jean

    Please add more keyboard shortcut to navigate around the Web console.

    Example in the debugger:
    – Add new debugging expression
    – Focus left panel and navigate through the files
    – Focus text editor

    In console:
    – Focus console input ( it sometimes loses focus when navigating around tabs)

    Thanks

    January 15th, 2014 at 02:29

Comments are closed for this article.