New Features of Firefox Developer Tools: Episode 25

Firefox 25 was just uplifted to the Aurora release channel which means we are back to report about new features in Firefox Developer Tools.

Here’s a summary of some of the most exciting new features, and to get the whole picture you can check the complete list of resolved bugzilla tickets.

Black box libraries in the Debugger

In modern web development, we often rely on libraries like JQuery, Ember, or Angular, and 99% of the time we can safely assume that they “just work”. We don’t care about the internal implementation of these libraries: we treat them like a black box. However, a library’s abstraction leaks during debugging sessions when you are forced to step through its stack frames in order to reach your own code. To alleviate this problem, we introduced black boxing: a feature where you can tell the debugger to ignore the details of selected sources.

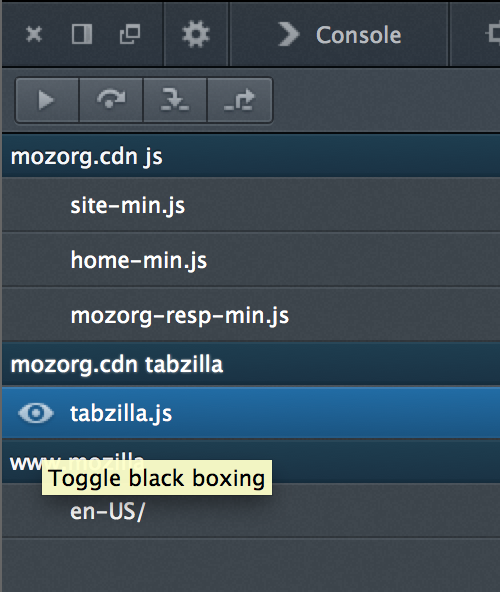
To black box a source, you can either mark them one at a time by disabling the little eyeball next to it in the sources list:
eyeball

Or you can black box many sources at once by bringing up the developer toolbar with Shift+F2 and using the dbg blackbox command:

dbg blackbox --glob *-min.js[source]

When a source is black boxed:

  • Any breakpoints it may have are disabled.
  • When “pause on exceptions” is enabled, the debugger won’t pause when an exception is thrown in the black boxed source; instead it will wait until (and if) the stack unwinds to a frame in a source that isn’t black boxed.
  • The debugger will skip through black boxed sources when stepping.

To see this in action and learn more about the details, check out the black boxing screencast on YouTube.

Replay and edit requests in the Network Monitor

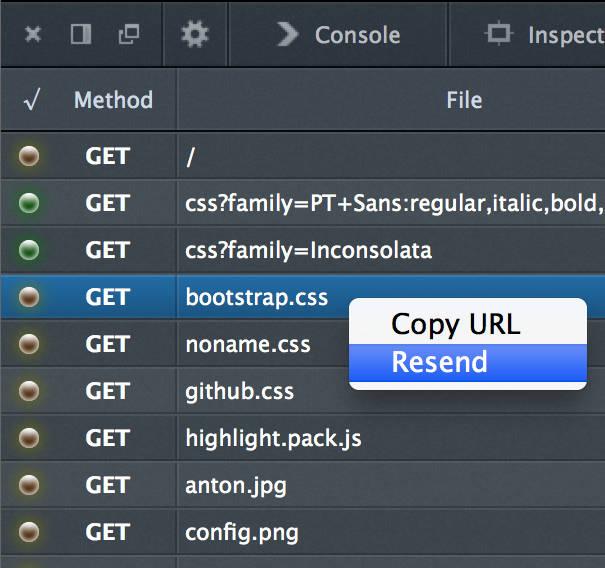
You can now debug a network request by modifying headers before resending it. Right-click on an existing request and select the “resend” context menu item:

resend request

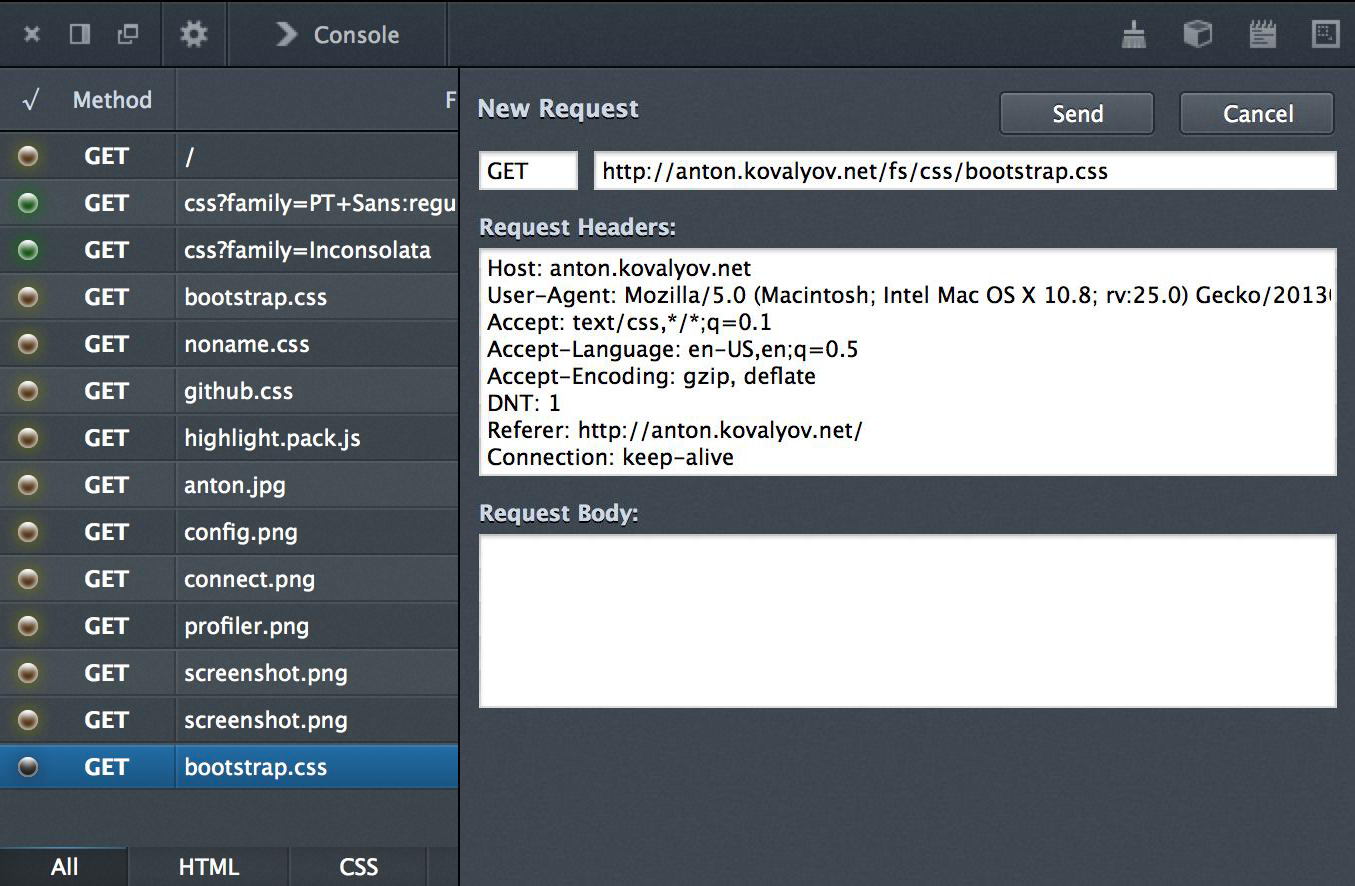
Now you can tweak the HTTP method, URL, headers, and request body before sending the request off again:

tweak

CSS Autocompletion in the inspector

Writing CSS in the inspector is now much easier as we enabled autocompletion of CSS properties and values.

autocomplete

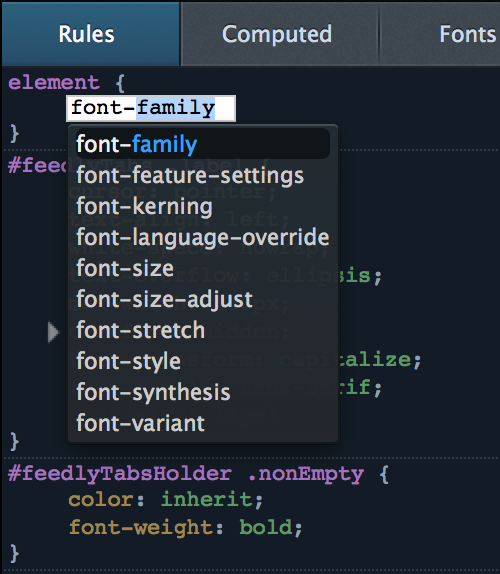
What’s more, it even works on inline style attributes

inline

Aside: this feature was implemented by contributors Girish Sharma and Mina Almasry. If you want to take your tools into your own hands too, check out our wiki page on how to get involved with developer tools.

Execute JS in the current paused frame

One request we’ve heard repeatedly is the ability to execute JS from the webconsole in the scope of the current paused frame in the debugger rather than the global scope. This is now possible. Using the webconsole to execute JS in the current frame can make it much easier to debug your apps.

Edit: The webconsole has actually been executing in the current frame since Firefox 23, in Firefox 25 the scratchpad will execute in the current frame as well.

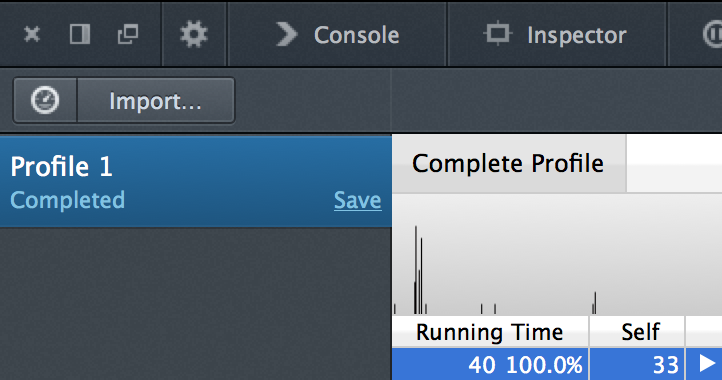
Import and export profiled data in the Profiler

Hacking on a shared project and think you found a performance regression in some bit of code owned by one of your friends? Don’t just file a github issue with steps to reproduce the slowness, export and attach a profile of the code that shows exactly how much slowness there is, and where it occurs. Your friend will thank you when he or she is trying to reproduce and debug the regression. Click the “import” button next to the start profiling button to load a profile from disk, and hit “save” on an existing profile to export it.

profileimport

When can I use these features?

All of these features and more are available in the Aurora release channel. In another 12 weeks, these features will roll over into Firefox stable.

Have some feedback about devtools? Ping @FirefoxDevTools on Twitter, or swing by #devtools on irc.mozilla.org.

About Nick Fitzgerald

I like computing, bicycles, hiphop, books, and pen plotters. My pronouns are he/him.

More articles by Nick Fitzgerald…

About Chris Heilmann

Evangelist for HTML5 and open web. Let's fix this!

More articles by Chris Heilmann…


37 comments

  1. phi2x

    One thing that I miss in the debugger tools is a way to list the JS functions that have been deoptimized by the Javascript engine, along with the reason behind those deoptimizing decisions.

    Such a tool would be of great help for optimizing our JS code.

    August 14th, 2013 at 01:46

    1. Nick Fitzgerald

      Follow along with this bug: https://bugzilla.mozilla.org/show_bug.cgi?id=897455

      August 14th, 2013 at 03:01

  2. Niloy Mondal

    W00h00! Blackboxing is awesome. Finally something for Blink to catch up to.

    August 14th, 2013 at 03:04

  3. Bradley Meck

    Is there a way to blackbox based on how the script is requested (ala source maps or ), then remove the blackbox as needed while debugging?

    August 14th, 2013 at 05:24

    1. Nick Fitzgerald

      We have a bug to add a ‘//# blackbox’ comment pragma that would tell the debugger that a source should be black boxed by default.

      https://bugzilla.mozilla.org/show_bug.cgi?id=905263

      August 15th, 2013 at 10:39

  4. Markus Koller

    Nice, but one thing that’s still bugging me about the devtools is that the inspector uses a tiny font for the HTML tree and the style box on the right, like 8px or so. The console, debugger and style editors all use a more reasonable font size.

    Could you either add a font setting, make sure all devtools use the same font size, or at least respect the minimum font size of 11px I’ve set?

    August 14th, 2013 at 05:50

    1. Markus Koller

      Oh and I’m on Linux by the way, if I remember correctly this problem doesn’t happen on Windows.

      August 14th, 2013 at 05:51

      1. Lin

        Have you checked your OS font settings?
        The dev tools use monospace for those parts here and some other font for the chrome.

        August 14th, 2013 at 09:50

    2. Kevin Newman

      In FireBug you could zoom that area independently from the main page. It’d be nice if you could do that in the bundled inspector too.

      August 14th, 2013 at 10:46

    3. Ken Saunders

      Agreed, the text is tiny and doesn’t match the browser’s chrome text.

      August 15th, 2013 at 04:43

    4. Nick Fitzgerald

      It’s on our radar :)

      August 15th, 2013 at 10:40

  5. Blaise Kal

    Are you guys working on something similar to Firebug’s “Show StackTrace with Errors”?

    The stack tracing / stepping in Firefox Developer Tools is not a useful alternative because there’s no quick way to see the call stack.

    I’d love to dump Firebug because it is very slow. This is the only thing that I really miss right now.

    August 14th, 2013 at 08:28

    1. Nick Fitzgerald

      If you click on the error, you should get the stack trace in the sidebar that pops up.

      We’re working on making the console output better: https://bugzilla.mozilla.org/show_bug.cgi?id=778766

      August 15th, 2013 at 10:42

      1. Blaise Kal

        Wow, that is an ambitious fix! Good luck and thanks for replying :)

        August 18th, 2013 at 09:53

  6. Ken Saunders

    Not that anyone really needs a screen shot but…
    http://www.accessfirefox.org/tmp-images/font-size.png

    August 15th, 2013 at 05:12

  7. Jingyu Wang

    It seems that black box is useful only when people haven’t concatenating their JavaScript files.

    August 15th, 2013 at 10:30

    1. Nick Fitzgerald

      You can do one of two things:

      1. Not concatenate the js files in you dev environment, and only when you build for production.

      2. Use source maps to translate the concatenated file back to the original sources (although you will have to wait on https://bugzilla.mozilla.org/show_bug.cgi?id=901712)

      August 15th, 2013 at 11:24

  8. Postmodern

    Could you please encode your videos in WebM before uploading them to youtube.

    August 15th, 2013 at 13:54

    1. Nick Fitzgerald

      I used quicktime and iMovie to record and edit the screencast respectively. Is there an easy way to export webm from iMovie?

      August 15th, 2013 at 13:58

    2. Chris Heilmann

      Why? YouTube sends it in the right format to the browser. Do you use the HTML5 version of YouTube? http://www.youtube.com/html5

      August 15th, 2013 at 16:10

  9. Jeremy Walton

    Personally I’m having a lot of problem with the built in tools. Esp for a medium to large web app project. Firebug seems to cause a lot of memory bloat but at least I’ve never had it not work for me. If you have over 500 javascript sources (development not production), after a while things like the profiler and console (when errors show up) where it shows a link to a js file/line number, it then proceeds to bring up a completely file (i.e. just tried 25 now, and ran the profiler, it said, 47% of my time was spent spent in core.js, so i’m like hey, thats kewl, click the arrow next to it, and it brings up… print.php? wait? what? there isn’t even any javascript in that file. Next, i’ve placed debugger lines in javascript code and its never fired the debugger while up. Also, I’ve put in manual break points and they first once, but never again, even though I know the code after it has worked (console.log’s). I’ve even tried turn off and back on the break point, no go. Funny enough, a restart of firefox allows the breakpoint to work again. I keep trying out the new developer tools every new iteration of new stuff. but I keep having to go back to firebug because I cannot trust anything the web developer tools give me (or not give me). This is all within 10 mins of running firefox 25… does the same in 24 and the currently released 23.

    August 15th, 2013 at 16:05

  10. Brandon

    Wow, this is awesome! Thanks for your hard work, these are things that are really going to make debugging in Firefox great again. Each of these are really fantastic useful features. I was reading through the first couple thinking “Sounds good and all, but when am I going to be able to debug w/ the console in the current context?!” Lo and behold, it is right there on the list. Hell yea, great job.

    August 15th, 2013 at 19:27

  11. pd

    “In modern web development, we often rely on libraries like JQuery, Ember, or Angular …”

    True, they are ubiquitous. So why don’t browser vendors do the web (in particularly the mobile web) a big performance boost by bundling these libraries with browsers? That would be faster than any performance tips I’ve ever read. No CDN can compete with a file already stored on a local machine. Imagine how much of an improvement it would make the mobile web if users did not have to download the (often uncompressed) 100K or so of libraries that many developers have to rely on when developing sites.

    All the evangelism, faster standards negotiation and rapid-releasing can’t beat tools that are actively developed to plaster over the inevitable cracks in browser implementations, not to mention provide a bevy of handy utility functions that standards developers don’t seem to focus on.

    It’s really a no-brainer, so again, why don’t browsers distribute the most common JavaScript libraries with browsers?

    August 16th, 2013 at 20:02

    1. Niloy Mondal

      Because different apps use different versions, doesnt seem feasible to me.

      August 19th, 2013 at 00:42

      1. pd

        Please excuse my abruptness because I’m really scratching my head wondering how someone can seemingly suggest that it’s impossible for a browser to download more than one version of a JavaScript library! You are not seriously? Your reply was an attempt at sarcasm wasn’t it? I hope so.

        Users indirectly instruct their browsers to download and store many different JavaScript libraries several times every hour. If I’m not mistaken, Firefox’s memory management system has even been adjusted recently to use the same memory space between two different sites/tabs if the memory is the same. In other words, I *think* if site a downloads jQuery 1.10.1 and site b does as well, Firefox sensibly only stores one copy of that library in memory. So in terms of downloading, storing and holding in memory, the browser already shares these libraries. Yet for some reason – perhaps pride? – browser vendors force users to continually download these libraries many times per day when they could simply be accessed from cache.

        Honestly I hope my reply is not rude, I just don’t understand your response. Perhaps I need more perspective. Anyone?

        August 19th, 2013 at 03:16

        1. Niloy Mondal

          When you said “bundling these libraries with browsers”, I took it as if you want these libraries to be built-in the browser. Your last paragraph suggested the same thing. Pardon me that I interpreted it in the wrong way.

          What you suggested in your second post, isnt it already possible? If multiple sites use jQuery from the same CDN, wouldnt they just be using it from the cache? Browsers never look inside a file to see if they are same or not(rightly so because string comparison of huge files would be too intensive). Instead they depend on URL to determine if a resource is same or not. Seems fair enough to me.

          August 20th, 2013 at 05:03

          1. Mauro

            Consider you can disable the cache and delete its content automatically. So, many users always get a new copy of the file anytime they navigate. Moreover, consider the fact that many developers store their libraries on their servers, they don’t get them from the same server anytime (third party server could even cause eventually download problems, temporarily breaking the website). And there could be many libraries in the same page. The reasons for a solution like the bundled library can be many, while I can’t find so many reasons for not having a feature like this one.

            September 11th, 2013 at 00:09

    2. Mauro

      @pd, I’m wondering the same since a lot of time, I can’t believe it! :-) At the moment this would be THE feature any browser should have. It could work like a plain old plugin: libraries get updated when there are new releases (of course, libraries should always be backward-compatible). Maybe there could be libraries that come with your browser by default (jQuery, for example) and other ones the user can freely add. This could be particularly useful in a mobile context, but even desktop would benefit.

      September 10th, 2013 at 23:58

  12. Misha Reyzlin

    The UI for interacting with current frame is still suboptimal – I want to have an overview of the currently running code *and* the console in the same view.

    The way that call stack is presented is also limiting – horizontal stacking doesn’t provide a clear overview.

    August 19th, 2013 at 03:25

    1. Nick Fitzgerald

      We have been exploring the best way to make the console available everywhere on the mailing list, and there is also this bug open: https://bugzilla.mozilla.org/show_bug.cgi?id=862558

      There’s also a bug for making the stack frames more traditional, but I don’t have the bug number at the moment.

      August 19th, 2013 at 10:38

  13. Cynthia

    A markup validator would rock my socks

    August 20th, 2013 at 08:15

  14. Mark

    The autocompletion on the Inspector just made my day. Fantastic. Is there a way I can override the theme colors for the Inspector. I have it set to dark them but I would like the highlight color for a line to be more striking like white text on a blue background so it is super easy to see.

    August 23rd, 2013 at 18:39

  15. Gene Vayngrib

    I have been having lots of trouble with debugging since ‘pause on exception’ stops in js code packaged with Firefox, which is not part of my app. So black boxing helps me with this problem, thank you. It would be even better if it was persisted over the Firefox restarts.

    Another big inconvenience is absence of ‘pause only on uncaught exceptions’. For example jQuery does some browser-specific checks that cause exceptions and then catches errors. So, I never want to stop there and do not want to bother blackboxing it either every time.

    Hope these things are in the pipeline.

    Hope these things are in a pipeline.

    August 23rd, 2013 at 22:56

  16. Gene Vayngrib

    @Jeremy, I’ve been having the same problem with breakpoints not being hit, or hit once and no more. Unfortunately I can not go to Firebug as I am debugging for FirefoxOS. May be someone can suggest a workaround?

    August 23rd, 2013 at 23:00

  17. Mark

    I really like the dark theme for the Inspector. I have always found it hard to see the current element selected so I removed the the noisy stippled borders around elements and I use a bright underline instead for clarity. I have a screenshot here: http://markbokil.com/images/screenshots/inspector-dark.png

    August 24th, 2013 at 15:58

  18. leandrw

    Great! Someday the firebug will not be useless anymore.

    August 27th, 2013 at 09:01

  19. 紫云飞

    “Execute JS in the current paused frame”, I don’t get it, can you make a screencast.

    September 4th, 2013 at 17:50

Comments are closed for this article.