Developer Tools Update – Firefox 22

This is the first in a series of posts published on or about the time a new Firefox version graduates from ‘Nightly’ status and becomes Firefox Aurora. We think that is the absolute best time to let you know about all the cool new developer-related features that have landed in the last 6 weeks, and we encourage you to check out Firefox Aurora if you haven’t already.

What’s that font?

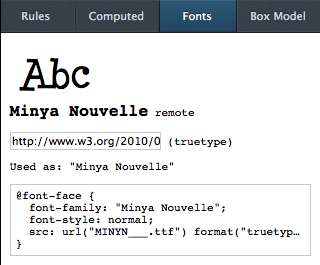
First up, a handy new pane has been added to the Inspector that lets you inspect whatever font rules are applied to the selected html node, or optionally you can view all fonts being used on the page in a single view:
Web_fonts_example

We see this as being particularly helpful for fine-tuning cross-platform font differences, or testing how web fonts are working in your app.

Let’s re-paint

The developer toolbox also has a new mode that visualizes what parts of the page are being re-painted by Firefox using a colorful ‘flashing’ effect. I recorded a quick 1-minute screencast to give you an idea of how it works:

In modern web apps we tend to rely heavily on JS libraries and CSS animations to bring user experiences alive, but in order to get the experience we need it’s important to understand how hard the browser is working to display the page. Visual Paint mode seeks to give insight into all of this.

Toolbox on the side

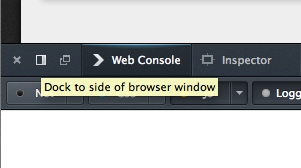
Wide-screen laptop and desktop LCD monitors are now the norm so we added a nice way to switch the Toolbox location to the right side of the browser window in addition to the bottom of the window or as a separate window:
dock-to-side

About Jeff Griffiths

Jeff is Product Manager for the Firefox Developer Tools and occasional Open Web hacker, based in Vancouver, BC.

More articles by Jeff Griffiths…


36 comments

  1. Girish

    Hi, Can you switch to secured version of embedded YouTube videos ? Nightly blocks http embeds in secured pages.

    April 11th, 2013 at 02:21

    1. Robert Nyman [Editor]

      Done!

      April 11th, 2013 at 07:11

  2. Bastian

    I wish you could focus on creating nice network statistics like loading metrics per every file(with bars), nice POST/GET information panel, some built-in speed test like firebug or chrome has.

    April 11th, 2013 at 02:28

    1. Christian Sonne

      The new network panel landed in nightly just the other day, here’s a screenshot of how it looks for this page http://i.imgur.com/TgQhTNe.jpg

      April 11th, 2013 at 02:37

    2. Victor Porof

      Check out Firefox Nightly ;) A network monitor has landed a few days ago.

      April 11th, 2013 at 02:41

    3. Panos Astithas

      For that you will need Firefox Nightly:

      https://twitter.com/victorporof/status/321250929993203713

      April 11th, 2013 at 03:06

    4. Anthony Ricaud

      This is actually being worked on. If you check a Nightly version of Firefox, this tool is in. See this screenshot http://bits.potch.me/netpanel.png

      April 11th, 2013 at 03:56

      1. Bastian

        Thanks! This is what i was waiting for. Im not using nightly builds, just final release Firefox, but i don’t mind to wait a bit longer for that. Very cool feature. I think mozilla dev tools will beat firebug soon ;) (in term of speed they won already)

        April 11th, 2013 at 04:37

        1. Mike Ratcliffe

          We work hard to make the tools fast and prevent them loading when the browser starts. This means that we only load stuff as and when we need it.

          We are glad you like the network monitor.

          April 11th, 2013 at 06:09

          1. Jeffrey

            I’m glad Firefox Dev Tools is finally getting a Network Panel. But I have a couple of questions.

            One, are these Dev Tools going to be view-able on Firefox for Android? No I’m *not* talking about Remote Debugging as I’d like to use them on something like the ODROID or Ouya without a PC.

            Two, will I be able to copy the link address like I can in Chrome’s Network panel?

            April 11th, 2013 at 06:34

          2. Jeff Griffiths

            Currently we don’t have any plans to implement developer tools in Firefox on Android, we are instead focused on connecting our remote developer tools capabilities to Firefox on Android and Firefox OS from Firefox on desktop.

            April 11th, 2013 at 09:34

      2. shaovunet

        And this is how I find http://firefoxnightly.tumblr.com/ :-)
        Thanks !

        April 11th, 2013 at 04:41

  3. Anonymous

    Please add an option to filter images, stylesheets and javascript from the network monitor.
    Sometimes it’s useful to monitor the requests for images, but most of the time it’s annoying to scroll over a lot of image requests to find one xhr.
    Also, a filter for 404, 403 and 500 responses would be very handy.

    April 11th, 2013 at 02:53

  4. Alexandru

    +1 for better network statistics. I’d be glad to switch from Firebug and that’s one of the major things that’s blocking me.

    April 11th, 2013 at 03:15

  5. Joe Developer

    Where did the commandline go?

    April 11th, 2013 at 03:56

    1. Kate

      I’m on version 22 and I can get to it with shift+f2.

      April 11th, 2013 at 07:31

  6. Mike

    @Anthony: That looks really good :) Looking forward to it!

    April 11th, 2013 at 04:53

  7. Mike Ratcliffe

    One thing that was not mentioned is that nightly now also includes a dark theme option. Until we add settings panels it must be enabled by:
    1. Open about:config
    2. Change devtools.theme from light to dark.

    This option was visible in earlier versions but wasn’t very good looking, it is still work in progress.

    April 11th, 2013 at 06:09

    1. Jeffrey

      Wait aren’t isn’t the dark theme the one that’s default? Or did you make a darker theme? Personally, Id prefer a lighter theme like the one in Chome’s Developer Tools. The current theme looks pretty but makes it’s harder for me to focus.

      April 11th, 2013 at 06:24

  8. Kate

    Hello, I’ve been trying out the firefox dev tools for a while recently and I really like what you’ve done! I’ve been noting down some things that have been annoying or things I think could be added or improved as I’ve been using it. I know some of these things have already been acknowledged, but maybe it will be useful…

    -needs to show box model (margins, padding, height and width etc.) when hovering over element in inspecto
    -tab for editing cookies and localStorage etc.
    -sometimes the window scrolls to top when you open inspector with ctrl+shift+i which is frustrating on tall pages when I have to scroll back to the bottom to inspect the node I wanted
    -f12 and ctrl+shift+c shortcuts should work if firebug is not installed
    -need ability to disable “if you leave this page, the changes you have made will be lost” warning, along the lines of “don’t ask me again” in a dropdown on the bar
    -need to be able to edit and easily select node contents in inspector tab
    -difficult to add attributes to nodes – sometimes they don’t seem to get added after you press enter
    -measure it style ruler – maybe this should stay as an addon, but it’s really annoying that there is no keyboard shortcut for this particular add on

    Right hand pane of inspector tab
    -shouldn’t changes hex colours to rgb(); should leave them as whatever they were
    -should show :after and :before rules
    -need to be able to select and edit rules
    -should remember width of the frame so I don’t have to resize it every time I open the inspector
    -need to be able to right click url() and “copy image url” or “open image in new tab”, for example

    April 11th, 2013 at 06:27

  9. Alex

    Nice work guys!

    Is there a way to put the element styles at the bottom when I’m using the sidebar layout? a la firebug style? It gets really hard to work with a narrow vertical window.

    Also, is there an api/doc/etc to expand the dev tools?

    April 11th, 2013 at 06:28

    1. Jeff Griffiths

      We have started to implement and document some basic APIs on MDN, here:

      https://developer.mozilla.org/en-US/docs/Tools/DevToolsAPI

      This work in its beginning stages but you can already see some members of the team making interesting extensions, for example JSTerm:

      http://paulrouget.com/e/fxterminalv3/

      April 11th, 2013 at 13:19

      1. alex

        Yeah I saw JTerm that is why I was wondering :P

        April 11th, 2013 at 13:25

  10. Walter

    I really like what you’re doing with dev tools. Good job.

    Only thing that slightly annoys me are the color choices in the inspector. Please make the background color of selected nodes stand out more. #E5E5E5 is unnecessarily hard to see.

    April 11th, 2013 at 06:32

    1. Mike Ratcliffe

      We have a patch to switch between color types but we need a context menu mechanism before we land it. We certainly plan on adding that capability.

      April 11th, 2013 at 13:39

  11. Mike Ratcliffe

    The light theme is default and has dark toolbars etc. but light panels.

    The dark theme is selected by changing devtools.theme to dark in about:config. When this option is selected most of the panels are dark. You can see some differences here:
    https://bug836233.bugzilla.mozilla.org/attachment.cgi?id=719063

    April 11th, 2013 at 06:34

  12. Ashutosh Singh

    Hi Jeff,

    I was thinking why do we have devtools docking only to right of the window is it just copy from chrome? because if you see the workflow it make more sense to doc devtool on left of the window because we code in English language which is written left to right so it make more sense to right code on left and see the results on right isn’t it?
    I am not sure why chrome put it on Right side; is their any logical reason or it’s just hunch.

    April 11th, 2013 at 09:03

    1. Mike Ratcliffe

      Not copying, just trying to provide logical choices.

      Our thinking was that if the toolbox was docked to the left then when it opens it would push the whole of the webpage to the right, which is why we only chose to dock to the right.

      You do make a good point, for sites using RTL, providing an option to dock on the left makes sense.

      April 11th, 2013 at 11:59

      1. Jeff Griffiths

        I agree, I think the right-hand side was a good start, but as we make the Toolbox UI more configurable we should consider offering a left-side option. The RTL use case in particular is compelling to me.

        April 11th, 2013 at 13:15

  13. Wilson Bilkovich

    This looks superbly useful, and thanks for the widescreen toolbar support.

    April 11th, 2013 at 12:37

  14. Rafał

    Hi, first of all: I love your tools. But last changes to developer tools make them less comfortable to use for me. Two changes I don’t think were good idea:
    – before update to inspect elements I had to click the button ‘Inspect’ (‘Zbadaj’ in polish) on the bottom and that was it. Now I have to open tools panel and then click inspector button.
    – style editor before update was docked on the right. It was much bigger than now. To use it comfortably now you have to detach tool window.

    If I’m not clear and you’re interested in my opinion please contact me by email.

    April 13th, 2013 at 02:39

    1. Rafał

      I figure out that you can select inspector for good and to inspect just click ‘wrench’ button. Also it’s quite easy to get used to full screen mode (detached window) of tools panel. So ignore my previous comment.

      April 13th, 2013 at 06:33

  15. Andrey Petrov

    Toolbox on a side is nice!

    Console issue: messages and errors should always be sorted by time of occurrence and not grouped by type of message. So, if I have put couple console.log messages and got an error I should see:
    [10:33:45:205] debug msg 1
    [10:33:45:206] debug msg 2
    [10:33:45.208] TypeError: $(…).val(…) is undefined
    and not:
    [10:33:45.208] TypeError: $(…).val(…) is undefined
    [10:33:45:205] debug msg 1
    [10:33:45:206] debug msg 2

    April 18th, 2013 at 11:10

    1. Jeff Griffiths

      We’re glad you like the toolbox improvements!

      For the web console problem, not sure what your use case is, can you please log a bug:

      https://bugzilla.mozilla.org/enter_bug.cgi?product=Firefox&component=Developer%20Tools:%20Console

      April 19th, 2013 at 08:56

  16. wtf

    Bring back the style editor docking on the right…. the new panel layout below the page is absolutly bullshit. And the option to detach to a seperate window
    will not compensate this stupid change.

    April 24th, 2013 at 17:59

    1. Jeff Griffiths

      Thanks for the input – if you have some time can you also log a bug for this concern?

      https://bugzilla.mozilla.org/enter_bug.cgi?product=Firefox&component=Developer%20Tools:%20Style%20Editor

      April 25th, 2013 at 10:16

Comments are closed for this article.