NOTE: since this article was published, the Mozilla developer tools team has released the App Manager, a much more effective way to remotely debug Firefox OS apps. To find out more, read Using the App Manager on MDN.
If you’ve wanted to contribute to Gaia, or have been writing a webapp for Firefox OS, one of the pain points you probably ran into, when using either B2G desktop or testing on a device, is the lack of developer tools to inspect and debug your HTML, CSS and JavaScript.
Currently we have two tracking bugs, go ahead an vote on them to bump their priority, to track the work going into developing a native remote inspector and style editor for Firefox OS but, I have some pretty exciting news. You can have access to a remote debugger today.
And how is this possible I hear you ask? Well, one word: Weinre. Weinre is a project of the Apache Foundation and stands for WEb INspector REmote and is exactly what it’s name suggests, a tool in the same vein as Firebug or Webinspector but, able to run and debug web pages remotely. So, if you have used tools such as the Firefox Developer Tools or Chrome Dev Tools, using Weinre will be second nature. But enough talk, let’s get this up and running.
Setting Up Weinre
As Weinre runs on top of Node.js your first port of call would be to install Node.js. Node.js comes with NPM (Node Package Manager) bundled nowadays and this is then then what we are going to use to install Weinre. From a terminal run the following:
npm -g install weinre
NOTE: The -g flag is used to install Weinre as a global Node.js module for command line goodness but, on Linux and Mac, this means you most likely are going to need to run the above by prepending sudo to the above command.
Once the installation process is complete, we are ready to use Weinre to debug. But first, let’s make absolutely sure that Weinre was indeed installed successfully. In your terminal, run the following:
$ weinre --boundHost 127.0.0.1 --httpPort 9090
2013-01-28T10:42:40.498Z weinre: starting server at http://127.0.0.1:9090
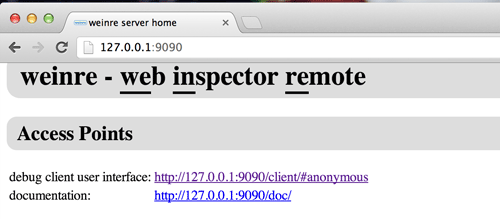
If you see a line similar to the last line above, your installation was a success and the Weinre server us up and running. With that, fire up a browser (NOTE: The UI for Weinre is built specifically for Webkit based browsers so, while it might work to some degree in other browsers, I would suggest you use Chrome) and point it to http://127.0.0.1:9090
Above then is the landing page for the Weinre server giving you access to the documentation, some other trinkets, as well as the Weinre client, the page we really want to head to so, go ahead and click on the debug client link.
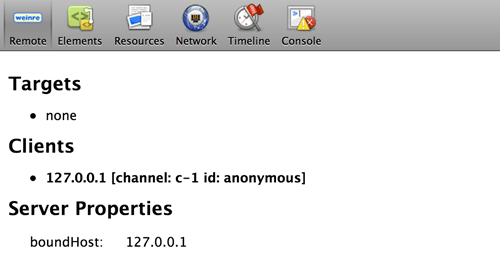
From the above you can see that we have one connected client, this is the current instance of the web inspector, some general properties of our server but, no targets. Let’s get our target set-up.
NOTE: If the UI of winery looks very familiar that’s because Winery uses the same UI code as the web inspector in Chrome and Safari.
Setting Up A Weinre Target
In Weinre targets are the web pages or apps that you want to debug, and in order for the target to be able to connect, we need to add a one liner to the relevant file of our app. For this post, let’s inspect the Calendar app. Go ahead and open up gaia -> apps -> calendar -> index.html and scroll right to the bottom. Just before the closing body tag, insert the following line:
Before we can launch B2G Desktop and try this out however, there is one more step. Gaia uses a Content Security Policy and as part of that scripts are said to only be allowed to load, if from the same origin as the application. So, if we were to try and load the Calendar now, the script from above would be blocked as it is not being loaded from the specified origin.
To overcome this, we need to temporarily disable CSP. To do this, open up gaia -> build -> preferences.js and add the following line, around line 24:
prefs.push(["security.csp.enable", false]);
Debugging Using Weinre and B2G Desktop
Now we are ready to test Weinre. If you are not already inside the Gaia root directory, change into it now and execute:
DEBUG=1 make
Once the profile is built, launch B2G desktop:
/Applications/B2G.app/Contents/MacOS/b2g-bin -profile /Users/username/mozilla/projects/gaia/profile
Once B2G launches, unlock the screen, swipe two screens to the right and click on the Calendar icon to launch the Calendar app. Once the app launches, you will see a new item appear on Weinre’s client dashboard:
As you can see, the Calendar has successfully connected and is now listed as one of our targets. Go ahead and click on the ‘Elements’ tab.
Listed here is the HTML of our app on the left and our CSS on the right! You can go right ahead and edit either the HTML or the CSS as you normally would and see the changes reflect live. Note that even though the CSS looks grayed out and disabled, it if fully editable. You can also add completely new styles to the current element using the empty element.style block or amending existing rules. You will also notice you have access to the computed styles as well as metrics of the current element.
Working With The Console
The next tab of interest to us is the Console tab. Here you can code away and run any JavaScript you want directly against the current app or execute code exposed by the app. To see how this works, let’s interact with the call log portion of the Dialer.
First step then is to move our script import from Calendar to Dialer. Grab the code from Calendar and then open up gaia -> apps – > communication -> dialer -> index.html and paste the code. Next rebuild your profile using ‘make’ and finally relaunch B2G desktop.
Once it is launched again, click on the Dialer icon at the bottom left of the home screen. Once loaded, confirm that the communication channels are open to Weinre by opening http://127.0.0.1:9090/client/#anonymous and confirming that the target now looks as follows:
127.0.0.1 [channel: t-7 id: anonymous] - app://communications.gaiamobile.org/dialer/index.html#keyboard-view
With the dialer open, click on the call log icon, bottom left. Currently the call log is already populated with some dummy data but, let’s create our own. Click over to the Console tab in Weinre, type the following and press enter.
RecentsDBManager.deleteAll();
If you look at the view on desktop now, it would seem that nothing has happened but wait, there is more. Type in the following and press enter:
Recents.refresh();
Aha! As you can see, our call log is empty. Next step then, is to add an entry back. To do this, we will create a dummy call entry Object and then pass this to the add function of the RecentsDBManager to store it:
// Dummy entry
var recentCall = {
    type: 'incoming-refused',
    number: '555-6677',
    date: new Date()
};
RecentsDBManager.add(recentCall);
Recents.refresh();
And as you can see now, the entry we just created has been added to storage, IndexedDB to be exact, and is visible in the call log view. As you might very well have noticed, another of the great features that comes with the console is auto-complete which will further speed up development.
The combination of features that this exposes already opens new doors and will make working on Firefox OS, or writing apps for the OS, much easier with less time spent between building profiles, tearing down and relaunching B2G. Which all makes for happier developers.
But hey wait a second, what about debugging on the device? This will work exactly the same as the above with one small difference, the IP. When you want to debug on the device you first need to know the IP address of your host computer. Then you need to start up Weinre using this IP as the buondHost and also as the IP when including the script into you target documents.
On Mac and Linux you can get this address using ifconfig and on Windows it is ipconfig. Once you have the new IP, just stop the current instance of Weinre and then do the following:
weinre --boundHost 192.168.1.1 --httpPort 9090
Then inside you target document add:
Make and push your Gaia profile to the device using:
make install-gaia
Launch your target app and you are in business!
Conclusion
While this solution is not perfect, you need to remember to undo your changes before committing anything to source control, having to manually add the script every time is not ideal and then there are also some things that do not work 100%, such as, highlighting DOM elements as you hover over the HTML source and debugging JavaScript with breakpoints and such, this does go a long way towards improving the lives of developers both working directly on Gaia as well as those writing exciting new apps for Firefox OS.
But there is already some light at the end of the tunnel with regards to managing the injection of the script manually, disabling CSP and ensuring things are cleaned up before pushing to source control. Jan Jongboom has opened a pull request against the Gaia repo that looks extremely promising and will alleviate a lot of this so, go on and give him a hand and let’s get this merged into Gaia. Happy Hacking!
An important note: None of the above would have happened if it was not for Kevin Grandon who remembered using Weinre and sent out the email that set the ball rolling. Thanks Kevin!
About Robert Nyman [Editor emeritus]
Technical Evangelist & Editor of Mozilla Hacks. Gives talks & blogs about HTML5, JavaScript & the Open Web. Robert is a strong believer in HTML5 and the Open Web and has been working since 1999 with Front End development for the web - in Sweden and in New York City. He regularly also blogs at http://robertnyman.com and loves to travel and meet people.


16 comments