Upcoming changes to the Firefox Developer tools node picker

If you are a user of the Firefox Developer tools you’ll soon see a change of the node picker of the Page Inspector component.

As documented on Bugzilla and reported by Patrick Brosset these changes mean:

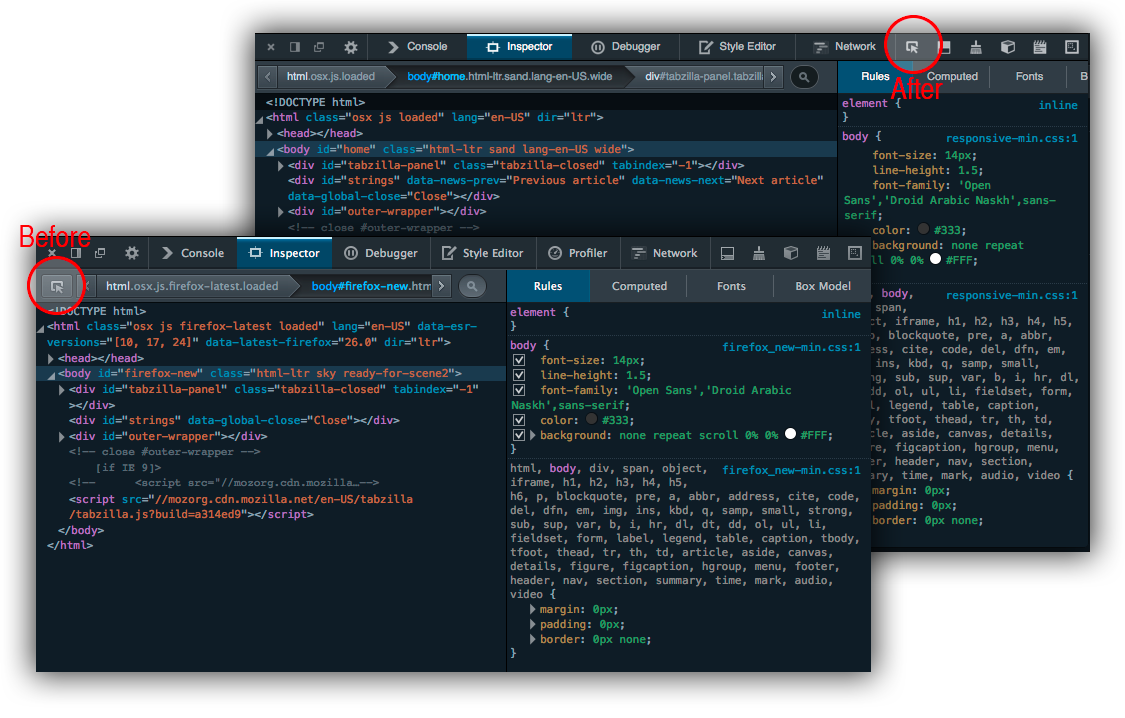
  • The node inspect button in the devtools has moved from the inspector-panel toolbar, on the left, to the toolbox toolbar, on the right:
    new node highlighter position in the devtools

  • The highlighter is shown as you hover over nodes in the markup-panel (instead of having to click on them)
  • What was called the “lock” state isn’t there anymore. This means, once a node is selected in the markup-panel or by using the inspect button and clicking on the page, the highlighter isn’t going to stay visible for as long as you don’t select another node. This was sometimes frustrating as it may be hiding things you wanted to see.

You can see the new functionality in action on YouTube.

This improves the compatibility in user interaction with other developer tools and makes it easier to move in between nodes should you have picked the wrong one.

Are there any other things you like to see in the Firefox Developer tools? Tell us, and don’t be shy to get involved and file bugs.

About Chris Heilmann

Evangelist for HTML5 and open web. Let's fix this!

More articles by Chris Heilmann…


14 comments

  1. Bob

    The tools are just getting better and better! Thank you to the team and their work.

    One thing though, why not having the inspect button to the far left like the other tools?

    January 23rd, 2014 at 01:49

  2. Hervé Renault

    Hi, I translated this article into french :
    http://mozillazine-fr.org/du-nouveau-dans-les-outils-pour-developpeurs-de-firefox/

    January 23rd, 2014 at 02:09

    1. Robert Nyman [Editor]

      Thanks for the translation!

      January 23rd, 2014 at 07:00

  3. Delapouite

    It seems that during this move of the inspect button to the main toolbar, a quite handy feature appeared : the Browser Toolbox (the one with chrome privilege) is now able to highlight elements of the Toolbox itself.

    This inception-like behavior eases the debugging of Devtools extensions. Thanks Patrick.

    January 23rd, 2014 at 02:34

    1. Mike Ratcliffe

      Making the inspector work remotely was a much larger part of the work but it is not visible until you inspect something remotely. Using the Browser Toolbox to inspect Firefox itself, Firefox OS apps etc. was one of the main reasons for moving the button from inside the inspector tool.

      Also, if any future tool other than the inspector needs to be able to pick a node the button is now available.

      January 23rd, 2014 at 06:20

      1. Luke

        Meaning that Browser Console tool will also have an inspector for Firefox and addons?

        January 23rd, 2014 at 08:15

        1. Victor Porof

          Yup! Here’s how to enable it right now (make sure you’re running Firefox Nightly):

          1. Open developer tools normally
          2. Go to the options panel
          3. Check “Enable Chrome debugging” and “Enable Remote debugging”

          Now go to the Web Developer menu in Tools and you’ll see Browser Toolbox. Those are the developer tools running against the browser.

          Chances are you’ll be able to debug your addons like simple web pages now. If you can’t, please file a bug and we’ll fix it.

          January 23rd, 2014 at 09:23

  4. elav

    I like the way it worked previous Inspector. Now is much like Chromium, which can not stand because when we mark an item, do not let set. No comment on the mistakes please. I want to make an element, and that stays fixed unless you select another number.

    My 5 cents

    January 23rd, 2014 at 06:36

  5. Dane MacMillan

    The progress of these developer tools are incredible. The lock state was frustrating, indeed. I filed a bug related to this a couple months back, and mentioned something else: the ability of the document to scroll the relevant area into view when hovering over its corresponding node in the inspector, or only scrolling the relevant document area into view when a node in the inspector has been clicked. At the moment the dashed selector highlighter just sort of plants itself against the boundaries of the viewport when the area in the document is out of view.

    https://bugzilla.mozilla.org/show_bug.cgi?id=936516

    January 23rd, 2014 at 08:16

  6. Max

    Great work guys!
    Can it highlight the margins and padding like FireBug does?

    January 23rd, 2014 at 08:55

    1. Mike Ratcliffe

      That is the next change that we are hoping to land for this release. We are waiting on another patch and still need to improve the box model highlighting code but we are hopeful that it will still make it in:

      http://bugzil.la/663778

      January 28th, 2014 at 06:50

  7. thinsoldier

    The overlay still doesn’t show margin and padding.

    January 30th, 2014 at 14:07

  8. Ignatius

    I think that box model highlighting its the only reason why I open firebug since Firefox 28. Hope to see it arrive soon!

    Great work!

    February 8th, 2014 at 10:37

    1. Mike Ratcliffe

      I just need to fix a few tests and then we can land it.

      February 10th, 2014 at 03:42

Comments are closed for this article.