Firefox Developer Tools: Episode 27 – Edit as HTML, Codemirror & more

Firefox 27 was just uplifted to the Aurora release channel which means we are back to report on new features in Firefox Developer Tools. Below are just some of the new features, you can also take a look at all bugs resolved in DevTools for this release).

JS Debugger: Break on DOM Events

You can now automatically break on a variety of DOM events, without needing to manually set a breakpoint. To do this, click on the “Expand Panes” button on the top right of the debugger panel (right next to the search box). Then flip over to the events tab. Click on an event name to automatically pause the next time it happens. This will only show events that currently have listeners bound from your code. If you click on one of the headings, like “Mouse” or “Keyboard”, then all of the relevant events will be selected.

Inspector improvements

We’ve listened to feedback from web developers and made a number of enhancements to the Inspector:

Edit as HTML

Now in the inspector, you can right click on an element and open up an editor that allows you to set the outerHTML on an element.

Select default color format

You now have an option to select the default color format in the option panel:

Color swatch previews

The Developer Tools now offer color swatch previews that show up in the rule view:

Image previews for background image urls

Highly requested, we now offer image previews for background image URLs:

In addition to above improvements, Mutated DOM elements are now highlighted in the Inspector.

Keep an eye out for more tooltips coming soon, and feel free to chime in if you have any others you’d like to see!

Codemirror

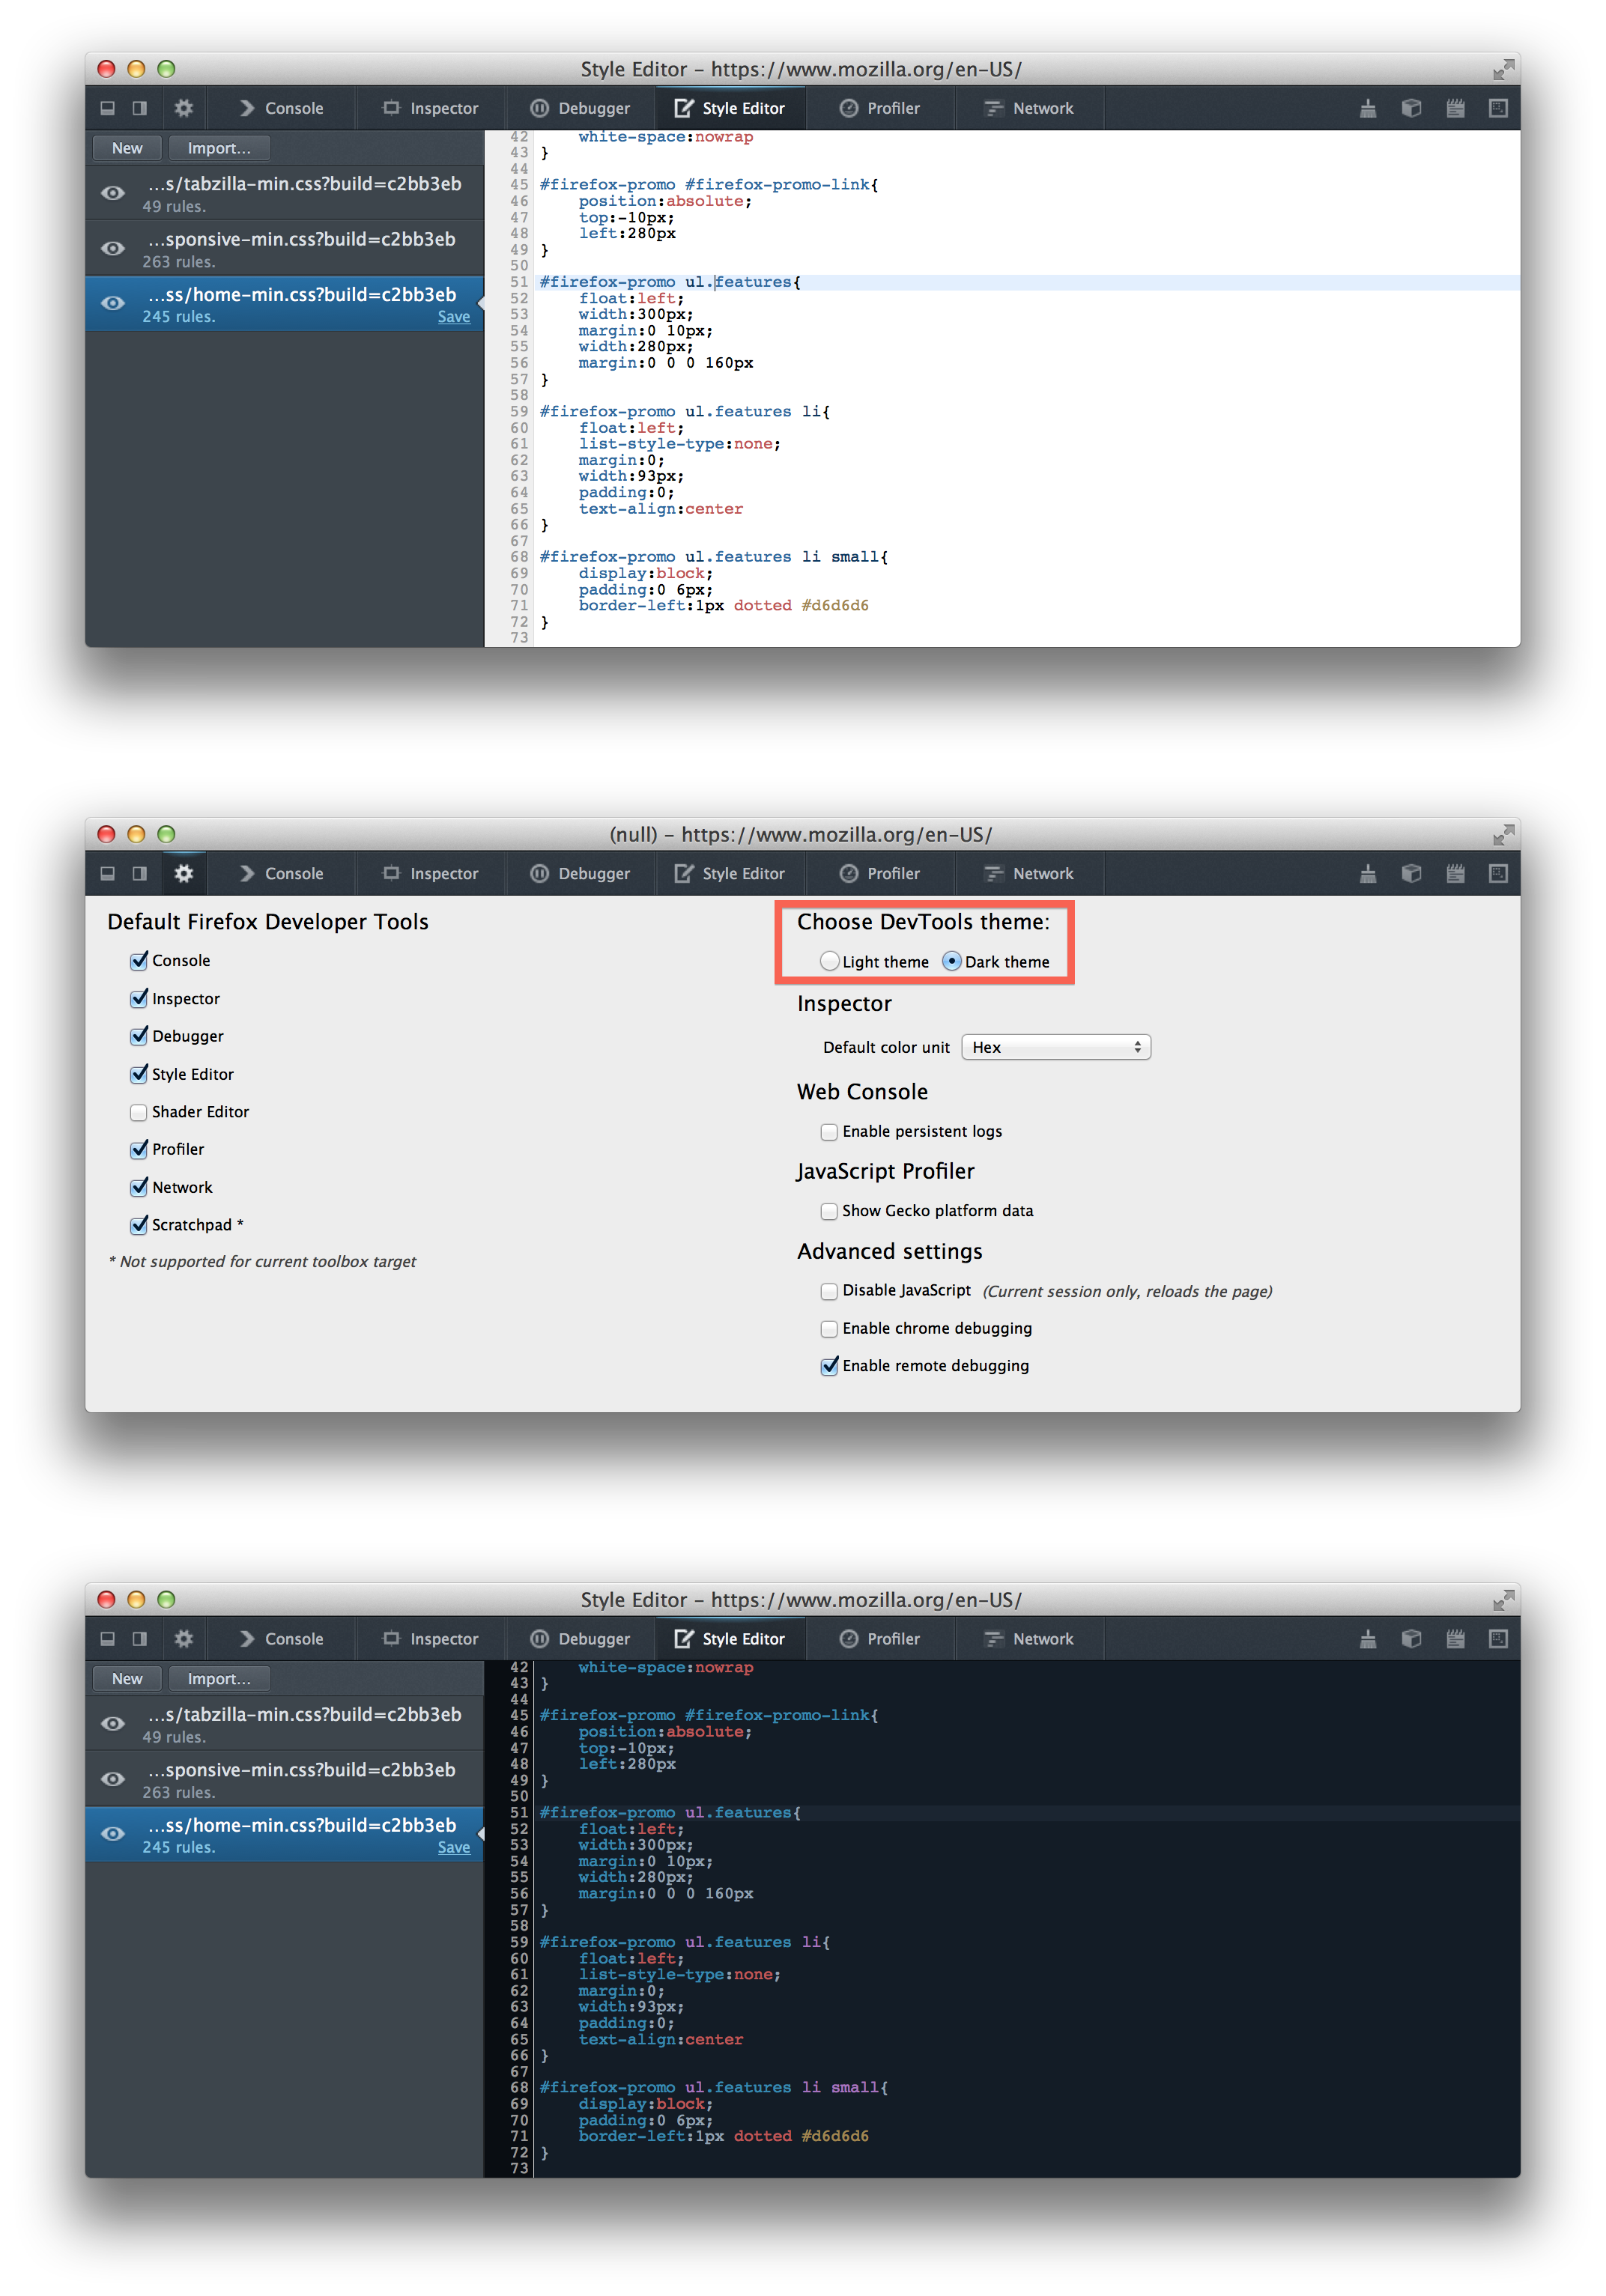
Codemirror is a popular HTML5-based code editor component used on web sites. It is customizable and theme-able. The Firefox Devtools now use CodeMirror in various places: Style editor, Debugger, Inspector (Edit as HTML) and Scratchpad.

From the Option panel, the user can select which theme to use (dark or light).

WebConsole: Reflow Logging

When the layout is invalidated (CSS or DOM changes), gecko needs to re-compute the position of some nodes. This computation doesn’t happen immediatly. It’s triggered for various reasons. For example, if you do “node.clientTop”, gecko needs to do this computation. This computation is called a “reflow”. Reflows are expensive. Avoiding reflows is important for responsiveness.

To enable reflow logging, check the “Log” option under the “CSS” menu in the Console tab. Now, everytime a reflow happens, a log will be printed with the name of the JS function that triggered this reflow (if caused by JS).

That’s all for this time. Hope you like the new improvements!

About Paul Rouget

Paul is a Firefox developer.

More articles by Paul Rouget…

About Robert Nyman [Editor emeritus]

Technical Evangelist & Editor of Mozilla Hacks. Gives talks & blogs about HTML5, JavaScript & the Open Web. Robert is a strong believer in HTML5 and the Open Web and has been working since 1999 with Front End development for the web - in Sweden and in New York City. He regularly also blogs at http://robertnyman.com and loves to travel and meet people.

More articles by Robert Nyman [Editor emeritus]…


50 comments

  1. Mindaugas J.

    You should map ‘edit outer HTML’ to the F2 key

    November 6th, 2013 at 12:05

    1. Brian Grinstead

      There is a bug opened for the F2 keybinding, it should be landing soon. You can follow it here if you’d like: https://bugzilla.mozilla.org/show_bug.cgi?id=892275.

      November 6th, 2013 at 19:01

  2. Chris

    Nice I hope there will be some support for SASS/LESS too in the future :) Now it’s only in firebug but it make’s it very slow to work with.

    November 6th, 2013 at 12:07

    1. Heather Arthur

      This is being worked on right now: https://bugzilla.mozilla.org/show_bug.cgi?id=926014. Original sources will be shown for any style sheets with a source map. Pre-release Sass supports source maps, but I don’t think LESS does right now, to the best of my knowledge.

      Thanks for taking the time to put in your vote.

      November 7th, 2013 at 10:32

  3. eric

    please highlight and show info about the padding and margin when hovering elements, it’s very useful to debug

    November 6th, 2013 at 12:09

    1. Paul

      We’re actively working on that.

      November 6th, 2013 at 16:43

    2. Jeff Griffiths

      We’re planning on implementing a new highliter in the next release or so.

      November 6th, 2013 at 18:19

    3. Brian Grinstead

      Here is the bug, if you’d like to follow along: https://bugzilla.mozilla.org/show_bug.cgi?id=663778.

      November 6th, 2013 at 19:03

  4. Bryce Fisher-Fleig

    I’ve ditched firebug for the built in developer since these cover 99% of what I want to do way faster than firebug can.

    However, I’d love to support for pseudo elements appearing in the inspector’s CSS pane. This is the biggest lack I’ve noticed since switching exclusively to developer tools from firebug.

    Great work on this release! I’m looking forward to where this is going.

    November 6th, 2013 at 12:23

    1. Paul

      Pseudo element are actually supported. See https://hacks.mozilla.org/2013/09/new-features-in-the-firefox-developer-tools-episode-26/

      November 6th, 2013 at 16:45

    2. Jeff Griffiths

      Pseudo element support should be available in Firefox 26: https://hacks.mozilla.org/2013/09/new-features-in-the-firefox-developer-tools-episode-26/

      November 6th, 2013 at 18:21

      1. Marian Kostadinov

        Unfortunately, hover func. is almost useless as it is not preserved after the next click in the dom tree.

        November 7th, 2013 at 10:29

  5. Nathan Demick

    The reflow logging looks awesome, can’t wait to check it out!

    November 6th, 2013 at 12:36

  6. Chuck

    Nice!

    Erratum: “You no have an option”

    November 6th, 2013 at 12:38

    1. Robert Nyman [Editor]

      Thanks, fixed!

      November 6th, 2013 at 12:47

  7. Chris Clarke

    Optionally having a Command Line at the bottom of the Debugger window (like Firebug) is essential when debugging js code.

    November 6th, 2013 at 13:28

    1. Jeff Griffiths

      Thanks for the feedback – we’ve gotten this suggestion from other developers as well and are working on plans to implement JS input in the debugger over the next few months.

      November 6th, 2013 at 18:22

      1. Luke

        At least you can add any expression in the watches window and see what it is, while debugging.

        November 7th, 2013 at 19:24

  8. Gene Vayngrib

    Great features! Reflow logging is invaluable for optimizing scrolling (that is until Chrome Timeline-like feature is available). Unfortunately the menu option Log is not available on CSS tab in Console pane in my Firefox Nightly 27.0a1 (2013-10-24) on Ubuntu 13.04.

    Also, did anyone notice that the builtin tools are eating CPU when idle, especially on the Debugger pane. Check it out on google.com

    November 6th, 2013 at 13:41

    1. Jeff Griffiths

      What OS are you on? I don’t see anything particularly bad, running on OS X 10.9 with Aurora 27. All I did was open up google.com with the debugger open.

      November 6th, 2013 at 19:17

  9. Flavio

    Great Job guys!!!
    Edit as HTML, background-image preview and color preview + HEX format!

    This is awsome! Really will make my life much easier

    Always been a fan of Firefox but this three small things forced me to rely on firebug that slowdown the whole browser. can wait to get this

    Keep it up gentlemen!

    November 6th, 2013 at 19:13

  10. Gene Vayngrib

    Jeff, I am on Ubuntu 13.04
    It does not repro on Aurora, which at this moment is still at version 26 on my Ubuntu. It does repro in Nightly (at version 27), but only after you click on the Debugger tab. Note that initially dev tools open on the Inspector tab, and this is one possibility why it did not repro for you. Hope this helps nail this sucker.

    November 6th, 2013 at 23:13

    1. Panos Astithas

      I am on 13.10 and do not see any big difference. Are you using the Ubuntu-provided nightlies (firefox-trunk) or the Mozilla-provided ones?

      Keep in mind that opening the debugger will always have some small perf impact as it will put the page in debug mode, which discards some JIT optimizations.

      November 7th, 2013 at 04:39

      1. Gene Vayngrib

        Panos, I am using firefox-trunk Ubuntu-provided package, aptitude shows version: 27.0~a1~hg20131023r151789-0ubuntu1~umd1~raring

        I understand that JIT is disabled, but I am not running anything. I understand that some timers could be firing on the page, or even a requestAnimationFrame, but Chrome dev tools barely registers in top. But when I open google.com in FF top shows CPU at 20% on 2-core machine and at 80% on github.com page. When I switch back to google.com CPU goes to 40%, when I come back to github.com – CPU remains at 40%. Bizarre. Hope this helps. We can switch this conversation to email and I can provide more info to help you pin it down.

        November 7th, 2013 at 08:35

  11. Nathan Kleyn

    I am *this* close to switching back to Firefox. These changes are amazing, and the speed at which you’re improving the dev tools is out of this world!

    Are there any plans for WebSocket debugging, specifically listing the sent and received frames? That’s the last thing I’m missing to make the switch.

    November 7th, 2013 at 02:31

    1. Panos Astithas

      Yes, we are working on WebSocket debugging:

      https://bugzilla.mozilla.org/show_bug.cgi?id=885508

      November 7th, 2013 at 04:35

  12. Mark V

    This is… beautiful. No separate Chrome-instead-of-a-browser for debugging anymore. Awesome.

    November 7th, 2013 at 04:18

  13. Adonis K.

    Wish you’d use Ace instead of codeMirror. It used to be mozilla’s project and it’s superior (at least when it comes to features)

    November 7th, 2013 at 04:46

  14. Tomer Cohen

    Most of the times I mention the Firefox Developers Tools Inspector, people are telling me that Firebug has the ability to edit HTML inline by just typing on the source view. Now that Firefox has something similar (and even better, as it highlights the element node source) it is better than nothing, but I suggest still implementing inline source editing, for people who are more familiar with Firebug.

    November 7th, 2013 at 05:03

  15. Sam

    In the last FF update (25) the inspector features autocompletion for css values, is great, but in Firebug if you press arrow keys you will see all the options. Any plans for this in FF?

    Thanks :)

    November 7th, 2013 at 05:06

    1. J. Ryan Stinnett

      We’re hope to make all values accessible via autocomplete, which sounds like it would address this issue.

      Follow along at https://bugzilla.mozilla.org/show_bug.cgi?id=912189.

      November 7th, 2013 at 09:59

      1. Sam

        Thanks for the info Ryan :)

        November 7th, 2013 at 10:21

  16. spirit

    Hi I have a small problem, I have a code that after 1s automatically sets the marginTop property for some box, and this box always stay in the same position (when scroll page).

    And now:
    1. How disable blink element in Inspector? It’s too distracting. Now I see my Rules panel (right side) blink too (looks like strobe effect), other tabs not blink (Computed, Fonts, Box Model).

    Everyone knows that blink efect is bad:) Why not make a less invasive signal? In Firebug we have just different background (yellow) for modified stuff (and Style panel not blink). Please add option for off blink and all will be happy (current background color is good).

    2. In this case I have a problem to select :hover, :active, :focus and all other options. When I click small down arrow I see all option, but after 1s this menu disappears (I guess it’s my fault code). When I use clasic context menu browser its always visible, but not context menu in Web Tools, even if I select element which do not change or click right mouse inside Inspector. This behavior is very inconvenient, and practically impossible to use this menu.

    Other comment:
    1. Color swatch previews – nice, but in my opinion this circle is too small, says little about color. It will be better if you add hover for rules and display slightly higher rectangle (as in Firebug).
    2. Image previews for background image and image (in HTML and CSS) is nice, but for me it’s too slow, thumbnails should pop up faster, it can be somehow faster?
    3. You can add pop up for font rules too (as in Firebug).
    4. How dissable border dashed in CSS rules (when hover rule)? When we have more rules this effect reduces readability.
    5. How set in Rules panel, that when we hover some single rule, checkbox (on/off) appears only for this rule, but not for all? Now this behaviour and previous (border dashed) reduces readability in this panel.

    Thanks for your attention and look forward to a reply. Nice to see that the built-in tools are constantly improving.

    November 7th, 2013 at 07:18

    1. Brian Grinstead

      We are working on at least a couple of these issues:

      Context menu disappearing: https://bugzilla.mozilla.org/show_bug.cgi?id=931990
      Make tooltip show up quicker: https://bugzilla.mozilla.org/show_bug.cgi?id=931845

      November 7th, 2013 at 08:01

  17. nniico

    Hi, the Break on DOM Events feature is great, but it could be interesting to have the target element opened in the inspector when clicked.
    Same in the Console and its properties panel: when we have a DOMNode as a value, changing it in a text field doesn’t make much sense. Why not open in in the inspector instead?

    November 7th, 2013 at 08:29

  18. Garito

    Would be nice if we could instantiate the editor in our html content instead of have to add the library again with js and then create the editor

    November 7th, 2013 at 08:39

  19. Mindaugas J.

    I’ll repost my experiences with debugging add-on here as I had no reaction in the previous blog post

    Remote/browser debugging add-ons does not always work.
    I have the following issues:

    On desktop scripts in chrome://myapp/preferences.html stop on breakpoints only on the first load of the debugging session. Afterwards it just ignores any breakpoints.

    On fennec the code running on tabInit stops on breakpoints only if you disable/reenable the add-on. Opening a new tab is not enough. DocLoad is fine though.

    On fennec chrome://myapp/preferences.html is undebuggable. Opening the tab process shows no sources. Breakpoints in the main process are ignored.

    Are these issues known? I would submit them to bugzilla if need be, but the question is, how many bugs I should create :P

    November 7th, 2013 at 13:35

    1. Jeff Griffiths

      Sorry we didn’t reply to you previously. I agree that there is more work that needs to be done to help add-on developers debug their add-on code.

      One of the more exciting projects from this year’s crop of Mozilla interns was the Add-on Debugger work by Mike Hordecki for the Jetpack team. Here’s his intern presentation from air mozilla:

      https://air.mozilla.org/intern-presentation-hordecki/

      We expect to land initial support for this based on Mike’s work by the end of the year, and improve on it to better support non-SDK-based add-ons in the future as well. Obviously from your point of view one of the key areas we need work work on is mobile support, and I would love if you could log bugs for the issues you’ve run into and cc me ( jgriffiths at mozilla dot com )

      November 7th, 2013 at 13:53

  20. Mindaugas J.

    Great video, thanks. I’m maintaining a non-sdk based bootstraped add-on so I’ll be awaiting those patches ;)

    For example, currently it’s not possible to debug the actual startup() in bootstrap.js. The presenter acknowledges it briefly so I’ll have my hopes up.

    I’ll open up some bugs once I find the time to build a minimal case add-on.

    November 7th, 2013 at 14:23

  21. Peter

    Will there be a Clear button on the Network tab in this release?

    November 7th, 2013 at 15:51

  22. voracity

    Out of curiosity, what were the reasons the Dev Tools team went for CodeMirror over Ace?

    November 7th, 2013 at 21:07

  23. Peter

    Will we see a Clear button on the Network tab?

    November 12th, 2013 at 01:38

    1. J. Ryan Stinnett

      A clear button is likely being added soon, but it hasn’t been done yet. Follow along here: http://bugzil.la/859057

      November 12th, 2013 at 08:46

  24. Learner

    With these good changes , i don’t think there will be need of Firebug addon . Chrome has one button to unminify Javascript to see the script properly ( i know a lot of other websites provide that ) but like chrome if FF does that it would be Great i guess.

    November 12th, 2013 at 13:16

    1. Jeff Griffiths

      Thanks for your comment! We have plans to support de-minification in Firefox 28 actually, follow along here:

      https://bugzilla.mozilla.org/show_bug.cgi?id=913665

      November 12th, 2013 at 14:30

  25. Felix Nagel

    Great news indeed!

    What about using the console.log functionality?
    Will console.log(“test”) now have a more sane output?
    Will console.log($(“myElement”)) highlight the actual element in the DOM?

    November 13th, 2013 at 06:18

  26. Ryan B.

    I cannot get the Aurora download to complete the install, so until that happens even trying out the cool dev tools seems to be out of reach!

    November 18th, 2013 at 14:04

    1. Robert Nyman [Editor]

      If the problem persists, please ask for Firefox support.

      November 19th, 2013 at 05:15

      1. Ryan B

        I tried it again sometime later and the install finally worked! Playing around with Aurora now! Thanks!

        November 20th, 2013 at 10:03

        1. Robert Nyman [Editor]

          Great to hear!

          November 20th, 2013 at 17:02

Comments are closed for this article.