
Today Mozilla is pleased to announce the availability of Firefox Developer Edition 40 (DE 40) featuring all-new performance tools! In this post we will cover some of DE 40’s new developer tools, fixes, and improvements made to existing tools. In addition, a couple of videos showcase some of these features.
Note: Many of the new features were introduced in May, in an earlier Mozilla Hacks post.
Introducing the new performance tools
Firefox Developer Edition features a new performance tool that gives developers a better understanding of what is happening from a performance standpoint within their applications. Web developers can use these tools to profile performance in any kind of website, app, or game; for a fun insight into how these tools can be used to optimize HTML5 games, check out our post about the “Power Surge” game right after you’re done here.
All performance tools can now be found grouped together under the Performance tab, for easier usage. Performance is all about timing, so you can view browser events in the context of a timeline, which in turn can be extended to include a number of detailed views based on the metrics you choose to monitor.
In the following video, Dan Callahan demonstrates how to use the new performance tools.
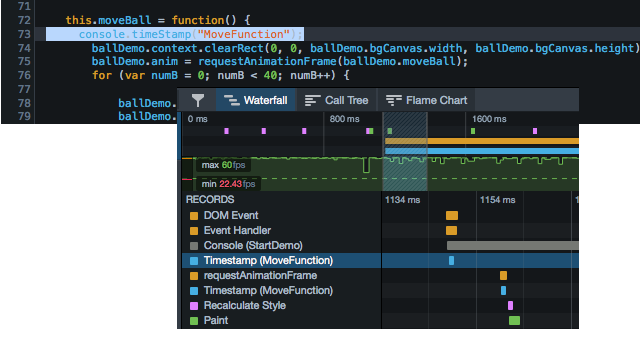
The Performance tab contains the new timeline, which includes: Waterfall view, Call Tree view and a Flame Chart view.
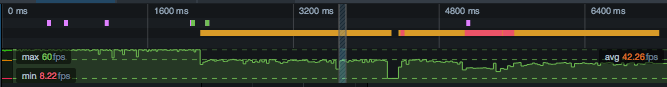
All of the views above provide details of application performance that can be correlated with a recorded timeline overview. The timeline displays a compressed view of the Waterfall, minimum, maximum, and average frame rates, and a graphical representation of the frame rate. Left-clicking on the view and dragging to the desired range allows you to zoom into this timeline. This also simultaneously updates all three new views to represent a particular selected range.
The recording view gives developers a quick way to zoom into areas where frame rate problems are occurring.
The Waterfall view provides a graphical timeline of events occurring within the application. These events include markers for occurrences such as reflows, restyles, JavaScript calls, garbage collection, and paint operations. Using a simple filter button you can select the events you want to display in the Waterfall.

You can use console commands like console.timeStamp() to indicate, with a marker on the Waterfall, when a specific event occurs. Also, you can graphically show timespans using the console.time() and console.timeEnd() functions.
The Call Tree view shows the results of the JavaScript profiler for the specified range. Using this view you can see the approximate time spent in a function. The table displays total time spent within a function call or the self-time that a particular function call is using. The total time encapsulates all time spent in the function and includes time spent in nested function calls. The self-time only includes time spent in the particular function, excluding nested calls. This view can be very helpful when trying to locate functions that are consuming a large portion of processing time. This view has been available in previous iterations of Firefox, and should be familiar to developers who have used the tool in the past.
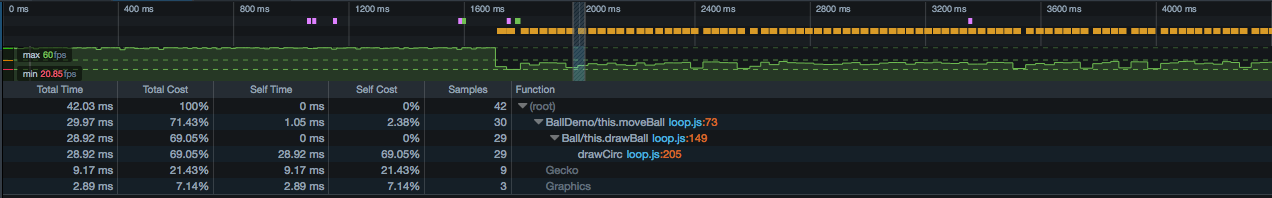
The Flame Chart view is similar to the Call Tree in that it graphically illustrates the call stack for a selected range. For example, in the screenshot below the drawCirc() function is taking over 25 milliseconds (ms) to complete, which is larger than the allotted time for frame generation to produce 60 frames per second.

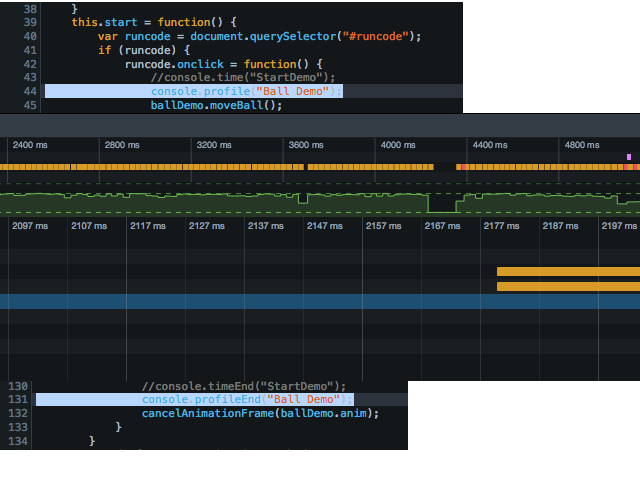
Performance profiles can be created, saved, imported, or deleted. In addition, multiple profiles can be opened at once to contrast and compare performance statistics between runs. Profiles can be created programmatically or using the console, by entering console.profile(“NameOfProfile”) to start a profile and console.profileEnd(“NameOfProfile”) to stop a profile. This allows you to fine-tune when profiling starts and stops within your code.
You can find complete docs for the performance tools on MDN. These include a tour of the UI, reference pages for each of the main tools, and some examples in which we use the tools to diagnose performance problems in CSS animations and JavaScript-heavy pages.
Additional features and improvements
In addition to the new Performance tools we’ve also implemented many new convenience features — mostly inspired by direct feedback from developers via our UserVoice channel — and over ninety bug fixes, representing a ton of hard work over the last eight weeks from Firefox Developer Tools staff as well as many contributors. Please continue to submit your feedback.
This video from Matthew “Potch” Claypotch shows off some the most requested feature implementations for Developer Edition 40.
Network Monitor improvements
As seen in the video above, the Network Monitor includes many improvements such data collection when the Network Tab is not active, and the ability to see quickly when an asset is loaded from the cache as opposed to the network.
It is now possible to copy post data, URL parameters, and Request and Response headers using the context menu when selecting a row entry.

CSS docs integration
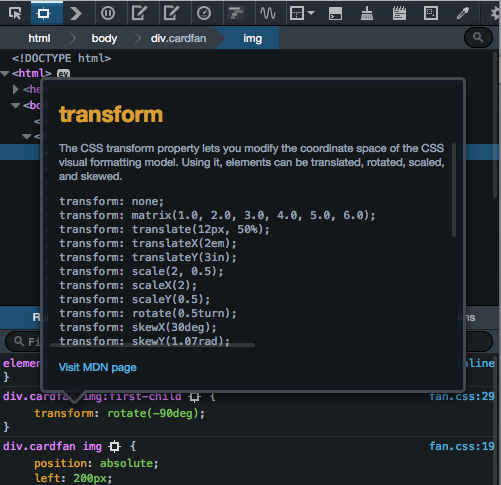
Firefox Developer Tools now support integration with MDN documentation for CSS properties, providing more information for developers while they are debugging web app styling and layout. To access this feature, you can right-click (Ctrl + click on Mac) on CSS properties within the Inspector, and select “Show MDN Docs” from the context menu.
Improved Inspector layout
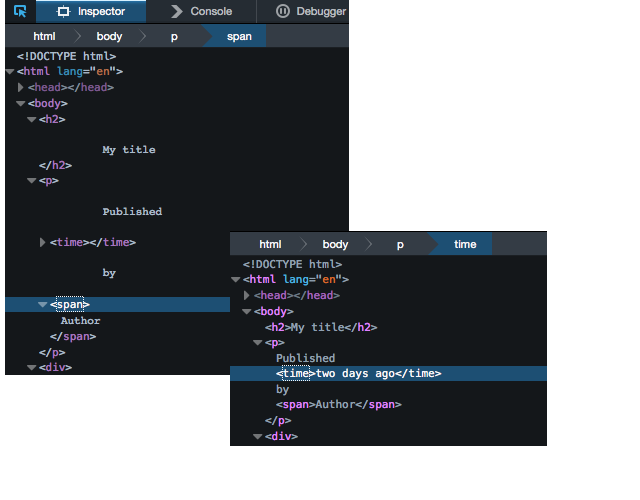
In the Inspector, whitespace in text node layout is cleaned up, providing a better view of your markup.
Additional fixes
Many additional fixes are also included, like improvements to the Animation Inspector, scroll into view context menu support and Inspector search improvements. To see all the bugs addressed in this release have a look at this big list in Bugzilla.
We’d like to send a gigantic special thank you to all the contributors and individuals who reported bugs, tested patches, and spent many hours working to make Firefox Developer Tools impressive.
About Dave Camp
Dave Camp is Director of Engineering for Firefox at Mozilla.
20 comments