
In Firefox 98, we’re shipping a new version of the existing Performance panel. This panel is now based on the Firefox profiler tool that can be used to capture a performance profile for a web page, inspect visualized performance data and analyze it to identify slow areas.
The icing on the cake of this already extremely powerful tool is that you can upload collected profile data with a single click and share the resulting link with your teammates (or anyone really). This makes it easier to collaborate on performance issues, especially in a distributed work environment.
The new Performance panel is available in Firefox DevTools Toolbox by default and can be opened by Shift+F5 key shortcut.
Usage
The only thing the user needs to do to start profiling is clicking on the big blue button – Start recording. Check out the screenshot below.
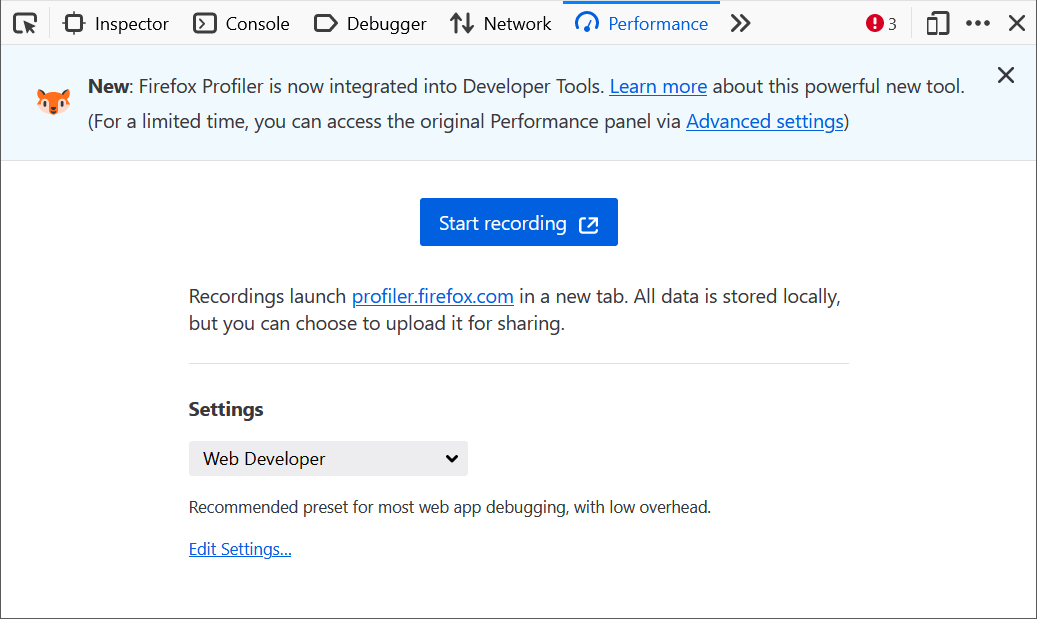
As indicated by the onboarding message at the top of the new panel the previous profiler will be available for some time and eventually removed entirely.
When profiling is started (i.e. the profiler is gathering performance data) the user can see two more buttons:

- Capture recording – Stop recording, get what’s been collected so far and visualize it
- Cancel recording – Stop recording and throw away all collected data
When the user clicks on Capture recording all collected data are visualized in a new tab. You should see something like the following:
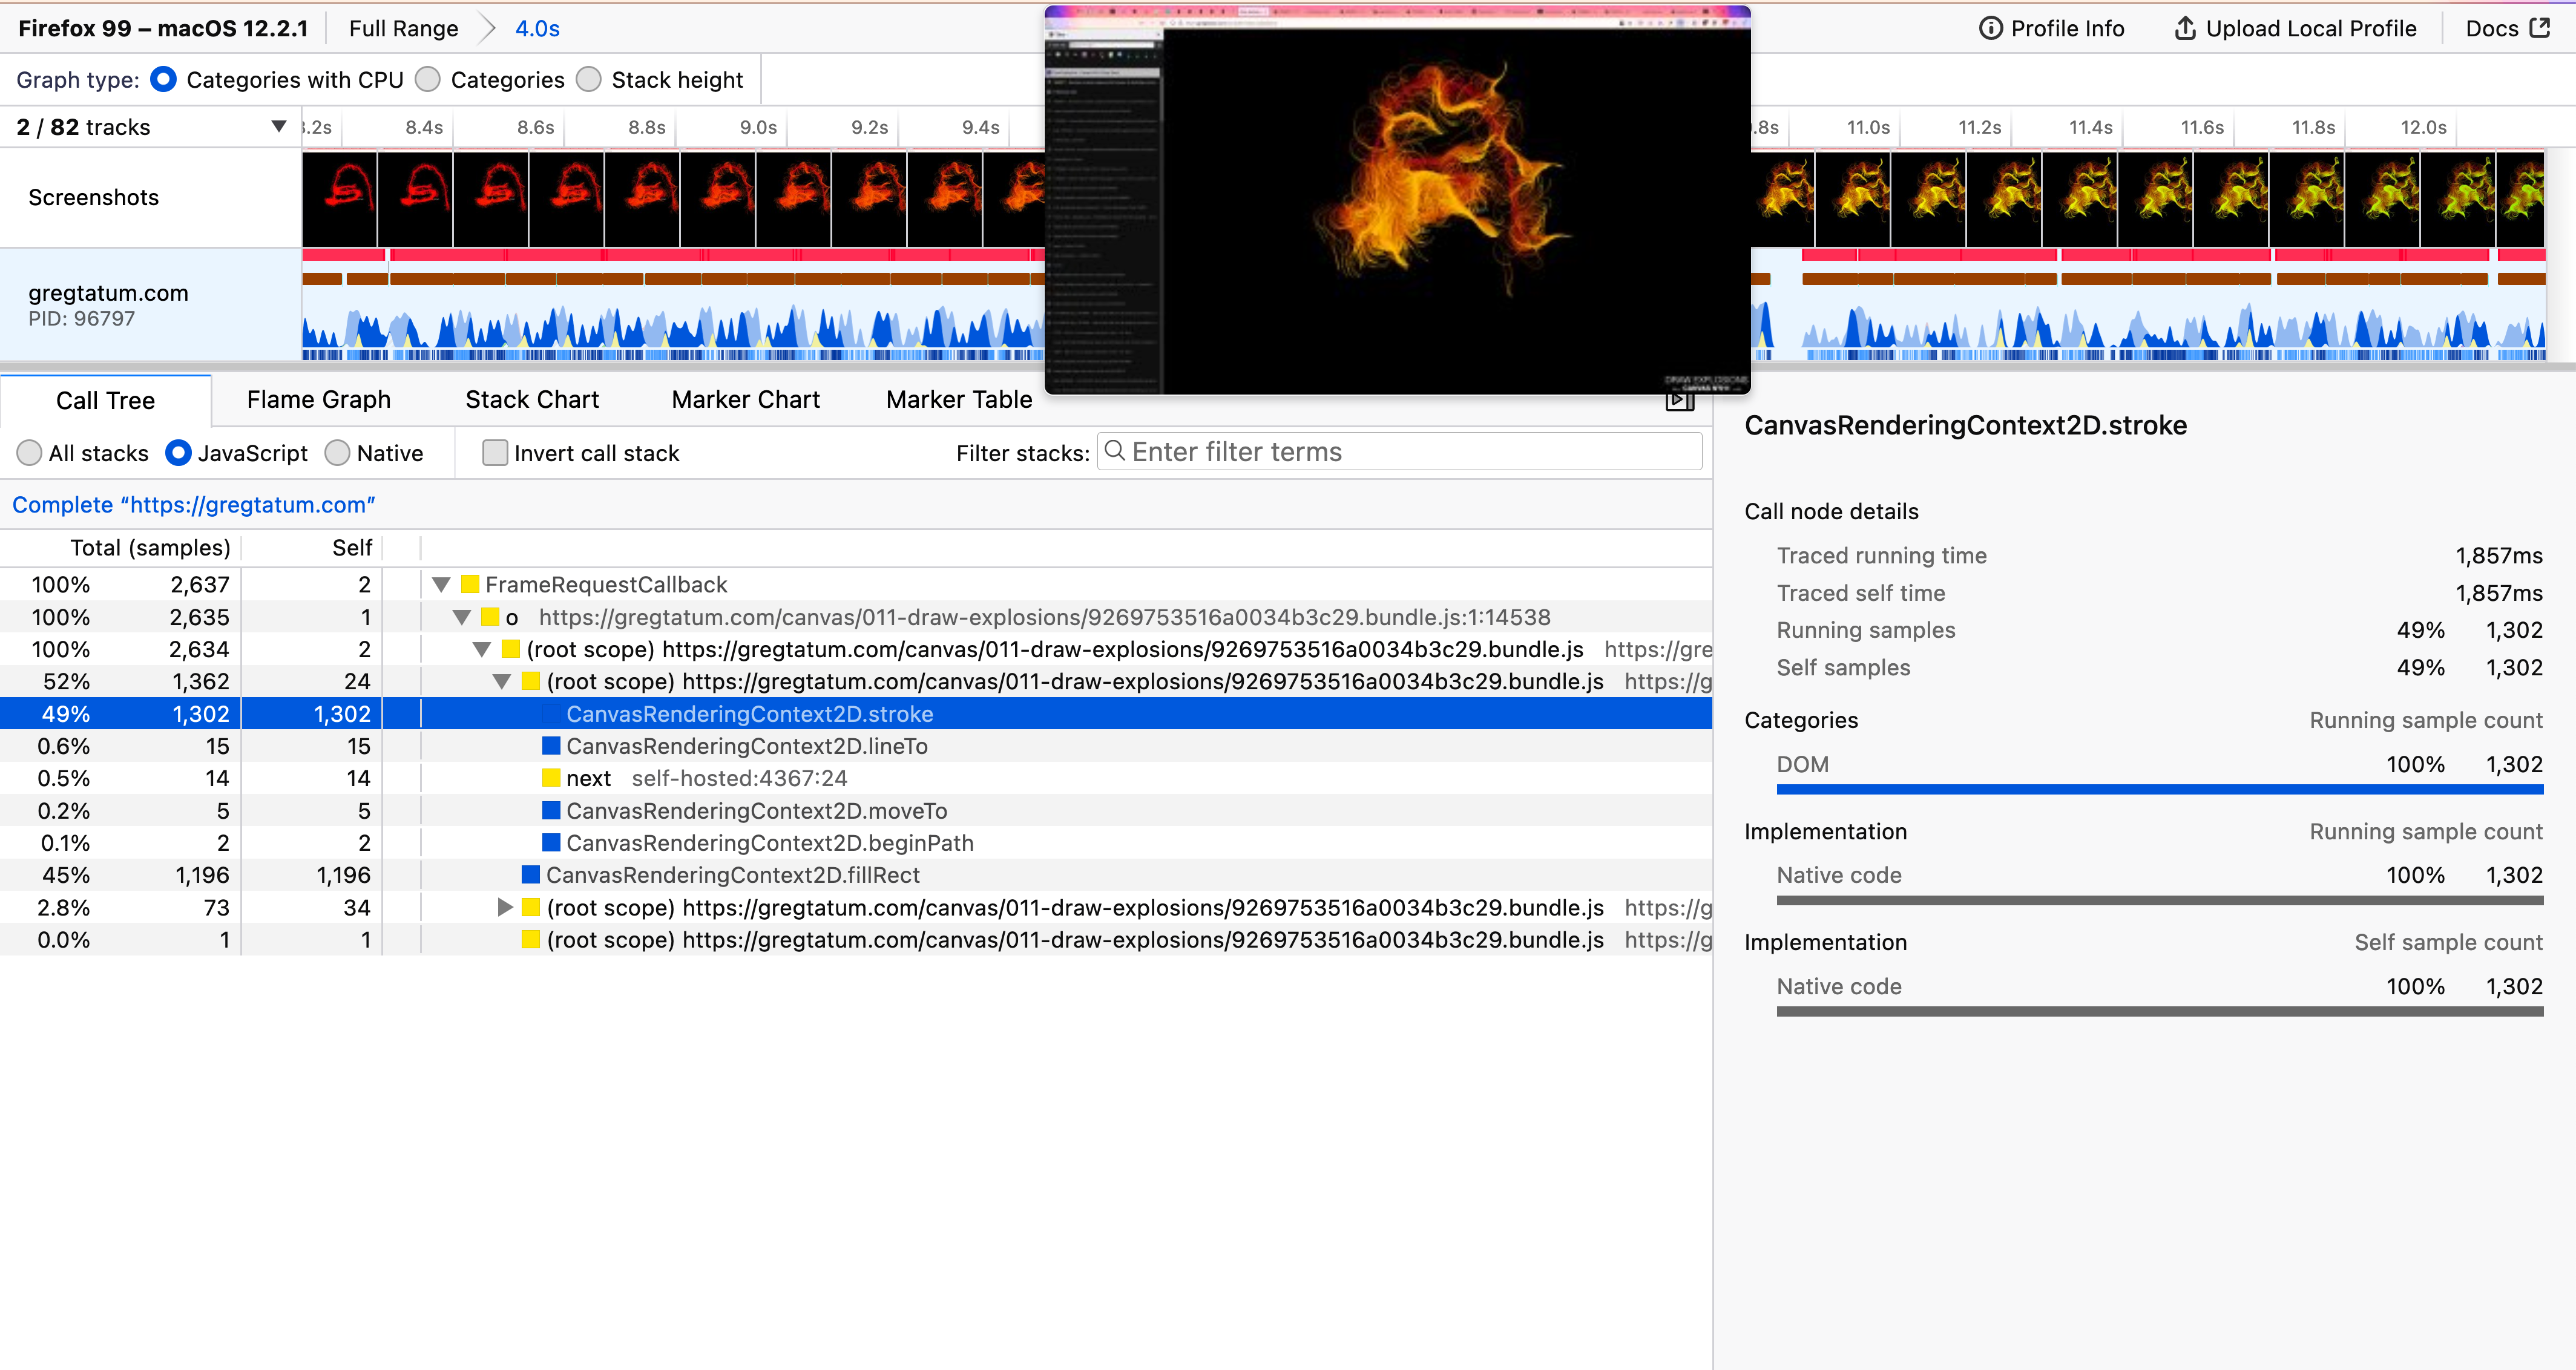
The inspection capabilities of the UI are powerful and let the user inspect every bit of the performance data. You might want to follow this detailed UI Tour presentation created by the Performance team at Mozilla to learn more about all available features.
Customization
There are many options that can be used to customize how and what performance data should be collected to optimize specific use cases (see also the Edit Settings… link at the bottom of the panel).
To make customization easier some presets are available and the Web Developer preset is selected by default. The profiler can be also used for profiling Firefox itself and Mozilla is extensively using it to make Firefox fast for millions of its users. The WebDeveloper preset is intended for profiling standard web pages and the rest is for profiling Firefox.
The Profiler can be also used directly from the Firefox toolbar without the DevTools Toolbox being opened. The Profiler button isn’t visible in the toolbar by default, but you can enable it by loading https://profiler.firefox.com/ and clicking on the “Enable Firefox Profiler Menu Button” on the page.
This is what the button looks like in the Firefox toolbar.
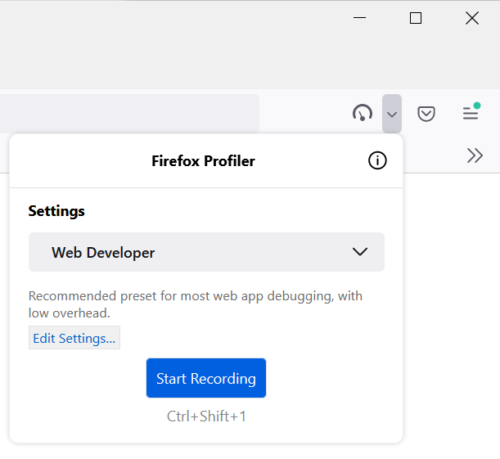
As you can see from the screenshot above the UI is almost exactly the same (compared to the DevTools Performance panel).
Sharing Data
Collected performance data can be shared publicly. This is one of the most powerful features of the profiler since it allows the user to upload data to the Firefox Profiler online storage. Before uploading a profile, you can select the data that you want to include, and what you don’t want to include to avoid leaking personal data. The profile link can then be shared in online chats, emails, and bug reports so other people can see and investigate a specific case.
This is great for team collaboration and that’s something Firefox developers have been doing for years to work on performance. The profile can also be saved as a file on a local machine and imported later from https://profiler.firefox.com/

There are many more powerful features available and you can learn more about them in the extensive documentation. And of course, just like Firefox itself, the profiler tool is an open source project and you might want to contribute to it.
There is also a great case study on using the profiler to identify performance issues.
More is coming to DevTools, so stay tuned!
About Jan Honza Odvarko
Honza is working on Firefox Developer Tools
More articles by Jan Honza Odvarko…