
Firefox Profiler for performance analysis
Harald’s Introduction
Firefox Profiler became a cornerstone of Firefox’s performance work in the days of Project Quantum. When you open up an example recording, you first see a powerful web-based performance analysis interface featuring call trees, stack charts, flame graphs, and more. All data filtering, zooming, slicing, transformation actions are preserved in a sharable URL. You can share it in a bug, document your findings, compare it side-by-side with other recordings, or hand it over for further investigation. Firefox DevEdition has a sneak peek of a built-in profiling flow that makes recording and sharing frictionless. Our goal is to empower all developers to collaborate on performance – even beyond Firefox.
Early on, the Firefox Profiler could import other formats, starting with Linux perf and Chrome’s profiles. More formats were added over time by individual developers. Today, the first projects are emerging that adopt Firefox for analysis tools. FunctionTrace is one of these, and here is Matt to tell the story of how he built it.
Meet FunctionTrace, a profiler for Python code
Matt’s Project
I recently built a tool to help developers better understand what their Python code is doing. FunctionTrace is a non-sampled profiler for Python that runs on unmodified Python applications with very low (<5%) overhead. Importantly, it’s integrated with the Firefox Profiler. This allows you to graphically interact with profiles, making it easier to spot patterns and make improvements to your codebase.
In this post, I’ll discuss why we built FunctionTrace, and share some technical details of its implementation. I’ll show how tools like this can target the Firefox Profiler as a powerful open-source visualization tool. To follow along, you can also play with a small demo of it!
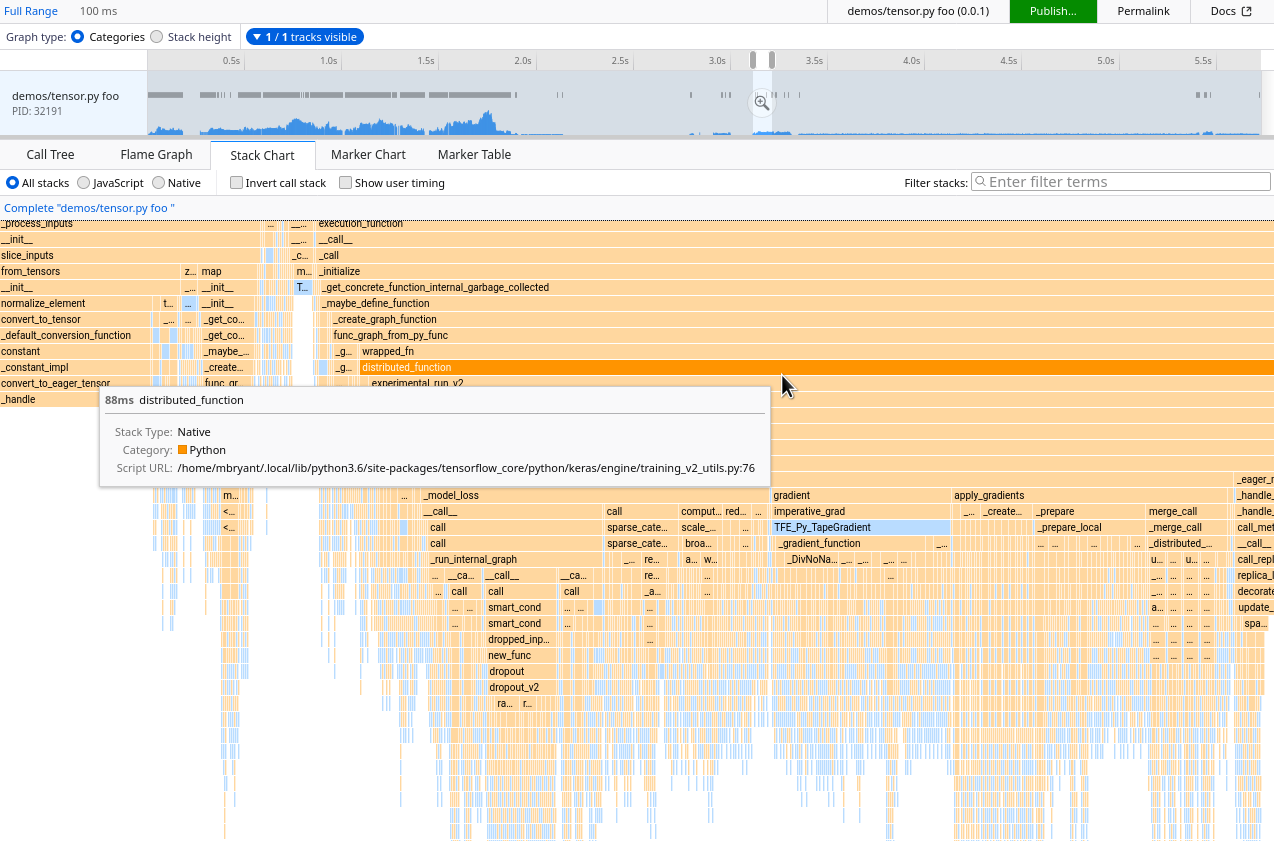
An example of a FunctionTrace profile opened in the Firefox Profiler.
Technical debt as motivation
Codebases tend to grow larger over time, especially when working on complex projects with many people. Some languages have great support for dealing with this, such as Java with its IDE capabilities built up over decades, or Rust with its strong type system that makes refactoring a breeze. Codebases in other languages sometimes seem to become increasingly less maintainable as they grow. This is particularly true in older Python codebases (at least we’re all on Python 3 now, right?).
It can be extremely difficult to make broad changes or refactor pieces of code you’re not familiar with. In contrast, I have a much easier time making correct changes when I’m able to see what a program is doing and all its interactions. Often, I even find myself making improvements to pieces of the code that I’d never intended to touch, as inefficiencies become glaringly obvious when presented on my screen.
I wanted to be able to understand what the Python codebases I work in were doing without needing to read through hundreds of files. I was unable to find existing tools for Python that were satisfactory, and I mostly lost interest in building a tool myself due the amount of UI work that would be necessary. However, when I stumbled across the Firefox Profiler, my hopes of quickly understanding a program’s execution were reignited.
The Profiler provided all of the “hard” pieces – an intuitive open-source UI that could display stack charts, time-correlated log markers, a flame graph, and the stability that comes from being tied to a major web browser. Any tool able to emit a properly-formatted JSON profile would be able to reuse all of the previously mentioned graphical analysis features.
Design of FunctionTrace
Luckily, I already had a week of vacation scheduled for a few days after I discovered the Firefox Profiler. I knew another friend who was interested in building it with me and also taking time off that week.
Goals
We had several goals when we started to build FunctionTrace:
- Give the ability to see everything occurring in the program.
- Handle multi-threaded/multi-process applications.
- Be low-overhead enough that we could use it without a performance tradeoff.
The first goal had a significant impact on the design, while the latter two added engineering complexity. From past experience with tools like this, we both knew the frustration of not being able to see function calls that are too short. When you’re sampling at 1ms but have important functions that run faster than that, you miss significant pieces of what’s occurring inside your program!
As a result, we knew we’d need to be able to trace all function calls and could not use a sampling profiler. Additionally, I’d recently spent time in a codebase where Python functions would exec other Python code (frequently via an intermediary shell script). From this, we knew we’d want to be able to also trace descendant Python processes.
Initial implementation
To support multiple processes and descendants, we settled on a client-server model. We’d instrument Python clients, which would send trace data to a Rust server. The server would aggregate and compress the data before generating a profile that could be consumed by the Firefox Profiler. We chose Rust for several reasons, including the strong type system, a desire for stable performance and predictable memory usage, and ease of prototyping and refactoring.
We prototyped the client as a Python module, called via python -m functiontrace code.py. This allowed us to easily use Python’s builtin tracing hooks to log what was executed. The initial implementation looked very similar to the following:
def profile_func(frame, event, arg):
    if event == "call" or event == "return" or event == "c_call" or event == "c_return":
        data = (event, time.time())
        server.sendall(json.dumps(data))

sys.setprofile(profile_func)
For the server, we listened on a Unix domain socket for client connections. Then we read data from the client and converted them into Firefox Profiler’s JSON format.
The Firefox Profiler supports various profile types, such as perf logs. However, we decided to emit directly to the Profiler’s internal format. It requires less space and maintenance than adding a new supported format. Importantly, the Firefox Profiler maintains backwards compatibility for profile versions. This means that any profile we emit targeting the current format version will be automatically converted to the latest version when loaded in the future. Additionally, the profiler format references strings by integer IDs. This allows significant space savings via deduplication (while being trivial to implement using indexmap).
A few optimizations
Generally, the initial base worked. On every function call/return Python would call our hook. The hook would then send a JSON message out over a socket for the server to convert into the proper format. However, it was incredibly slow. Even after batching the socket calls, we observed at least 8x overhead on some of our test programs!
At this point, we dropped down to C using Python’s C API instead. We got down to 1.1x overhead on the same programs. After that, we were able to do another key optimization by replacing calls to time.time() with <a href="https://c9x.me/x86/html/file_module_x86_id_278.html" target="_blank" rel="noopener noreferrer">rdtsc</a> operations via clock_gettime(). We reduced the performance overhead for function calls to a few instructions and emitting 64 bits of data. This was much more efficient than having a chain of Python calls and complex arithmetic in the critical path.
I’ve mentioned that we support tracing multiple threads and descendant processes. Since this was one of the more difficult pieces of the client, it’s worth discussing some lower-level details.
Supporting multiple threads
We install a handler on all threads via <a href="https://docs.python.org/3/library/threading.html#threading.setprofile" target="_blank" rel="noopener noreferrer">threading.setprofile()</a>. (Note: we register via a handler like this when we’re setting up our thread state to ensure that Python is running and the GIL is currently held. This allows us to simplify some assumptions.):
// This is installed as the setprofile() handler for new threads by
// threading.setprofile().  On its first execution, it initializes tracing for
// the thread, including creating the thread state, before replacing itself with
// the normal Fprofile_FunctionTrace handler.
static PyObject* Fprofile_ThreadFunctionTrace(..args..) {
    Fprofile_CreateThreadState();

    // Replace our setprofile() handler with the real one, then manually call
    // it to ensure this call is recorded.
    PyEval_SetProfile(Fprofile_FunctionTrace);
    Fprofile_FunctionTrace(..args..);
    Py_RETURN_NONE;
}
When our Fprofile_ThreadFunctionTrace() hook is called, it allocates a struct ThreadState, which contains information the thread will need to log events and communicate to the server. We then send an initial message to the profile server. Here we notify it that a new thread has started and provide some initial information (time, PID, etc). After this initialization, we replace the hook with Fprofile_FunctionTrace(), which does the actual tracing in the future.
Supporting descendant processes
When handling multiple processes, we make the assumption that children are being run via a python interpreter. Unfortunately, the children won’t be called with -m functiontrace, so we won’t know to trace them. To ensure that children processes are traced, on startup we modify the <a href="https://en.wikipedia.org/wiki/PATH_(variable)" target="_blank" rel="noopener noreferrer">$PATH</a> environment variable. In turn, this ensures python is pointing to an executable that knows to load functiontrace.
# Generate a temp directory to store our wrappers in.  We'll temporarily
# add this directory to our path.
tempdir = tempfile.mkdtemp(prefix="py-functiontrace")
os.environ["PATH"] = tempdir + os.pathsep + os.environ["PATH"]

# Generate wrappers for the various Python versions we support to ensure
# they're included in our PATH.
wrap_pythons = ["python", "python3", "python3.6", "python3.7", "python3.8"]
for python in wrap_pythons:
    with open(os.path.join(tempdir, python), "w") as f:
        f.write(PYTHON_TEMPLATE.format(python=python))
        os.chmod(f.name, 0o755)
Inside the wrappers, we simply need to call the real python interpreter with the additional argument of -m functiontrace. To wrap this support up, on startup we add an environment variable. The variable says what socket we’re using to communicate to the profile server. If a client initializes and sees this environment variable already set, it recognizes a descendant process. It then connects to the existing server instance, allowing us to correlate its trace with that of the original client.
Current implementation
The overall implementation of FunctionTrace today shares many similarities with the above descriptions. At a high level, the client is traced via FunctionTrace when invoked as python -m functiontrace code.py. This loads a Python module for some setups, then calls into our C module to install various tracing hooks. These hooks include the sys.setprofile hooks mentioned above, memory allocation hooks, and custom hooks on various “interesting” functions, like builtins.print or builtins.__import__. Additionally, we spawn a functiontrace-server instance, setup a socket for talking to it, and ensure that future threads and descendant processes will be talking to the same server.
On every trace event, the Python client emits a small MessagePack record. The record contains minimal event information and a timestamp to a thread-local memory buffer. When the buffer fills up (every 128KB), it is dumped to the server via a shared socket and the client continues to execute. The server listens asynchronously to each of the clients, quickly consuming their trace logs into a separate buffer to avoid blocking them. A thread corresponding to each client is then able to parse each trace event and convert it into the proper end format. Once all connected clients exit, the per-thread logs are aggregated into a full profile log. Finally, this is emitted to a file, which can then be used with the Firefox Profiler.
Lessons learned
Having a Python C module gives significantly more power and performance, but comes with costs. it requires more code, it’s harder to find good documentation; and few features are easily accessible. While C modules appear to be an under-utilized tool for writing high performance Python modules (based on some FunctionTrace profiles I’ve seen), we’d recommend a balance. Write most of the non-performance critical code in Python and call into inner loops or setup code in C, for the pieces where Python doesn’t shine.
JSON encoding/decoding can be incredibly slow when the human-readable aspect isn’t necessary. We switched to MessagePack for client-server communication and found it just as easy to work with while cutting some of our benchmark times in half!
Multithreading profiling support in Python is pretty hairy, so it’s understandable why it doesn’t seem to have been a key feature in previous mainstream Python profilers. It took several different approaches and many segfaults before we had a good understanding of how to operate around the GIL while maintaining high performance.
Please extend the profiler ecosystem!
This project wouldn’t have existed without the Firefox Profiler. It would’ve simply been too time-consuming to create a complex frontend for an unproven performance tool. We hope to see other projects targeting the Firefox Profiler, either by adding native support for the Profiler format like FunctionTrace did, or by contributing support for their own formats. While FunctionTrace isn’t entirely done yet, I hope sharing it on this blog can make other crafty developers aware of the Firefox Profiler’s potential. The Profiler offers a fantastic opportunity for some key development tooling to move beyond the command line and into a GUI that’s far better suited for quickly extracting relevant information.
About Matt Bryant
Matt is a programmer who enjoys designing secure and high performance systems. He lives in San Francisco, and spends most of his free time rock climbing.
About Harald Kirschner (digitarald)
Harald "digitarald" Kirschner is a Product Manager for Firefox's Developer Experience and Tools – striving to empower creators to code, design & maintain a web that is open and accessible to all. During his 8 years at Mozilla, he has grown his skill set amidst performance, web APIs, mobile, installable web apps, data visualization, and developer outreach projects.