
Today we’re mashing up two very different applications to make a cool personal dashboard for investigating all our internet-connected things, and their behavior over time. We can use one of the Web Thing API’s superpowers: its flexibility. Like Elastigirl or Mr. Fantastic, it can bend and stretch to fit into any situation.
This adaptability allows us to create a bridge between the Project Things gateway and Cloud Native Computing Foundation’s Prometheus.
Prometheus is a time-series database originally intended for supervising large clusters of servers. However, it’s easy to teach all of our internet-connected devices to pretend to be part of a fancy server farm.
We do this by squishing data from the Web Thing API into a series of raw data points stored in Prometheus. We’ll be getting all of this done using only free and open-source software without any data leaving our local network.
Installing the Translator
First, let’s set up the translation layer. This small utility will take data from the Web of Things API and translate it into values for Prometheus to consume and turn into pretty graphs. It starts off with a call to the gateway’s /things path to get a list of Thing Descriptions.
Next, it reads from the property resources of each described Thing to get the initial property values to send to Prometheus. The Translator then opens a WebSocket connection on each Thing to get future updates to properties. Finally, it makes all the property values available to Prometheus as a specially-formatted web page.
You can download this utility from GitHub. If you’re running the gateway on a Raspberry Pi you can log in and use the following commands to get the translator installed.
cd ~/mozilla-iot
git clone https://github.com/hobinjk/gateway-prometheus-translator/
cd gateway-prometheus-translator
npm install
Next, it’s time to make sure the translation layer knows where your gateway is. In my case, this is https://hobinjk.mozilla-iot.org, but if you’re just trying it out the gateway locally it might be http://localhost:8080 or http://gateway.local.
As long as you can visit the URL and see the main Things page of the gateway you’ve filled it out correctly. Save this URL for later, when we run the translator.
Now that the translator knows where it should get its data, we need to give it the proper identification to talk to our gateway securely. We can authorize the translator by issuing it an “identification card” from the gateway’s Local Token Service.
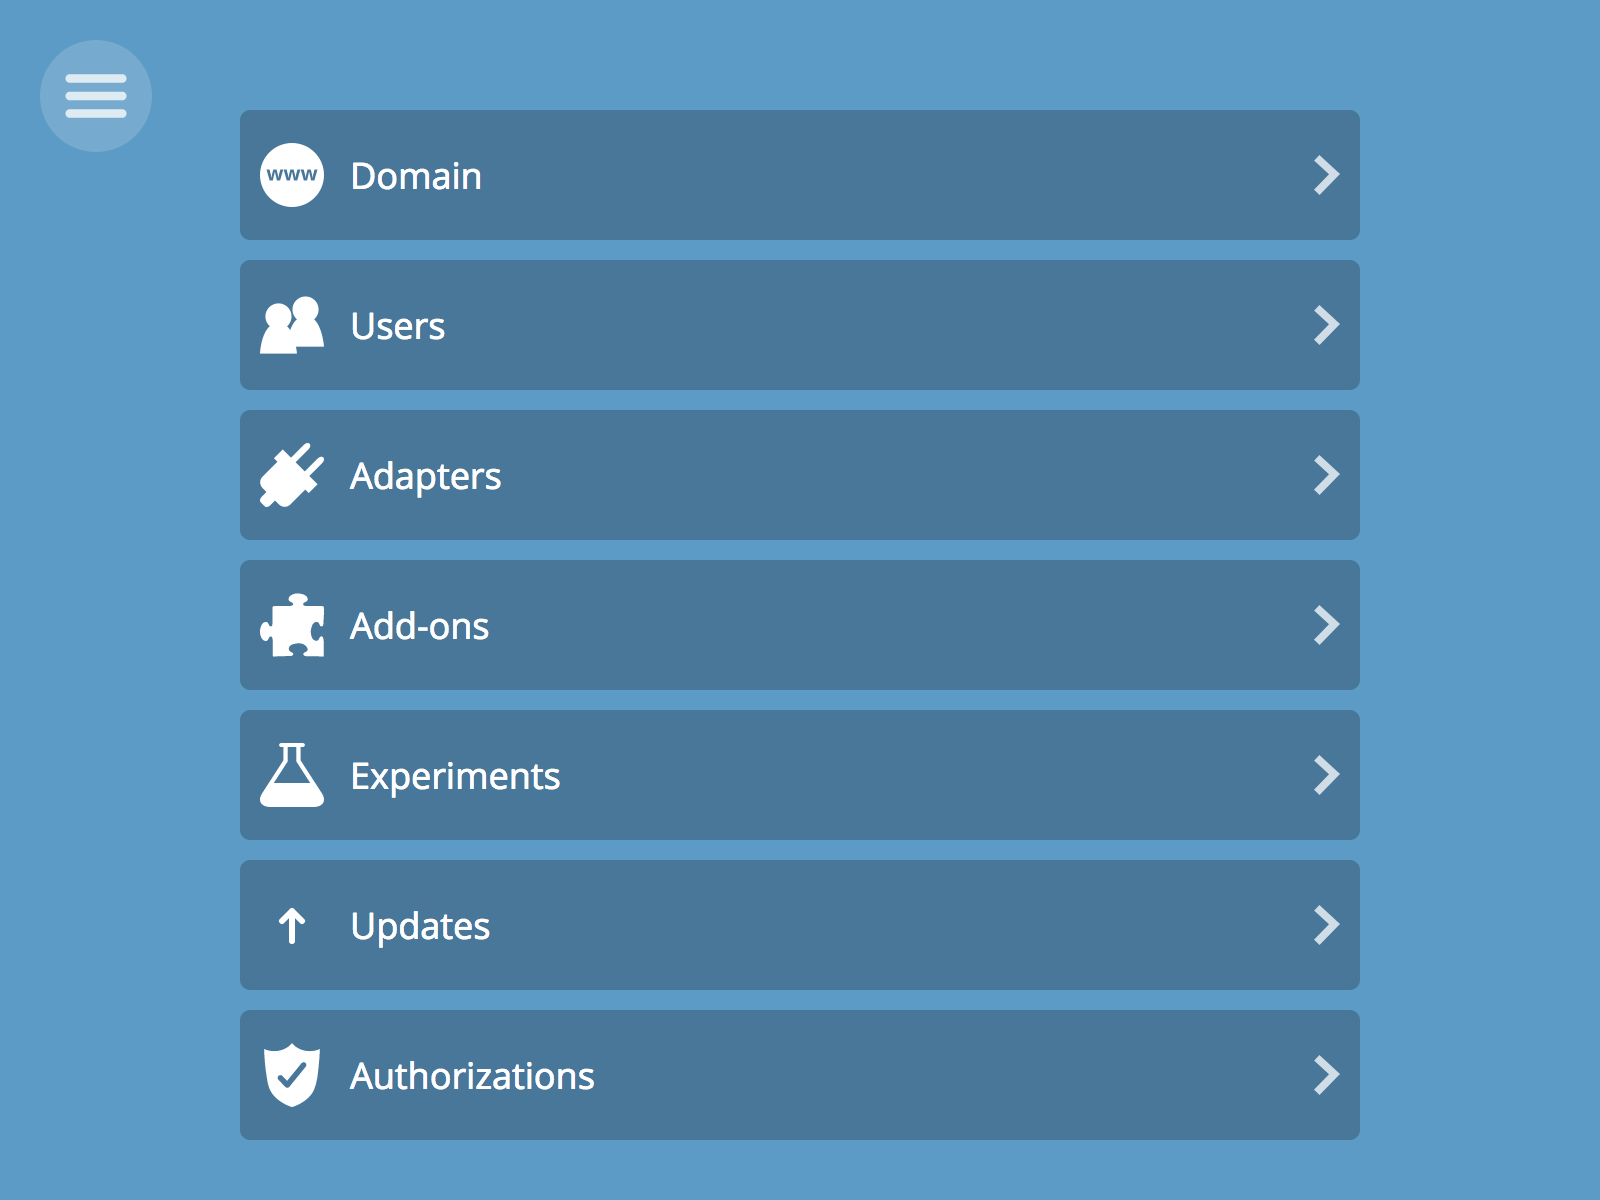
To start off, enter the “Settings” section of your Gateway by clicking on the menu button then on the settings tab.

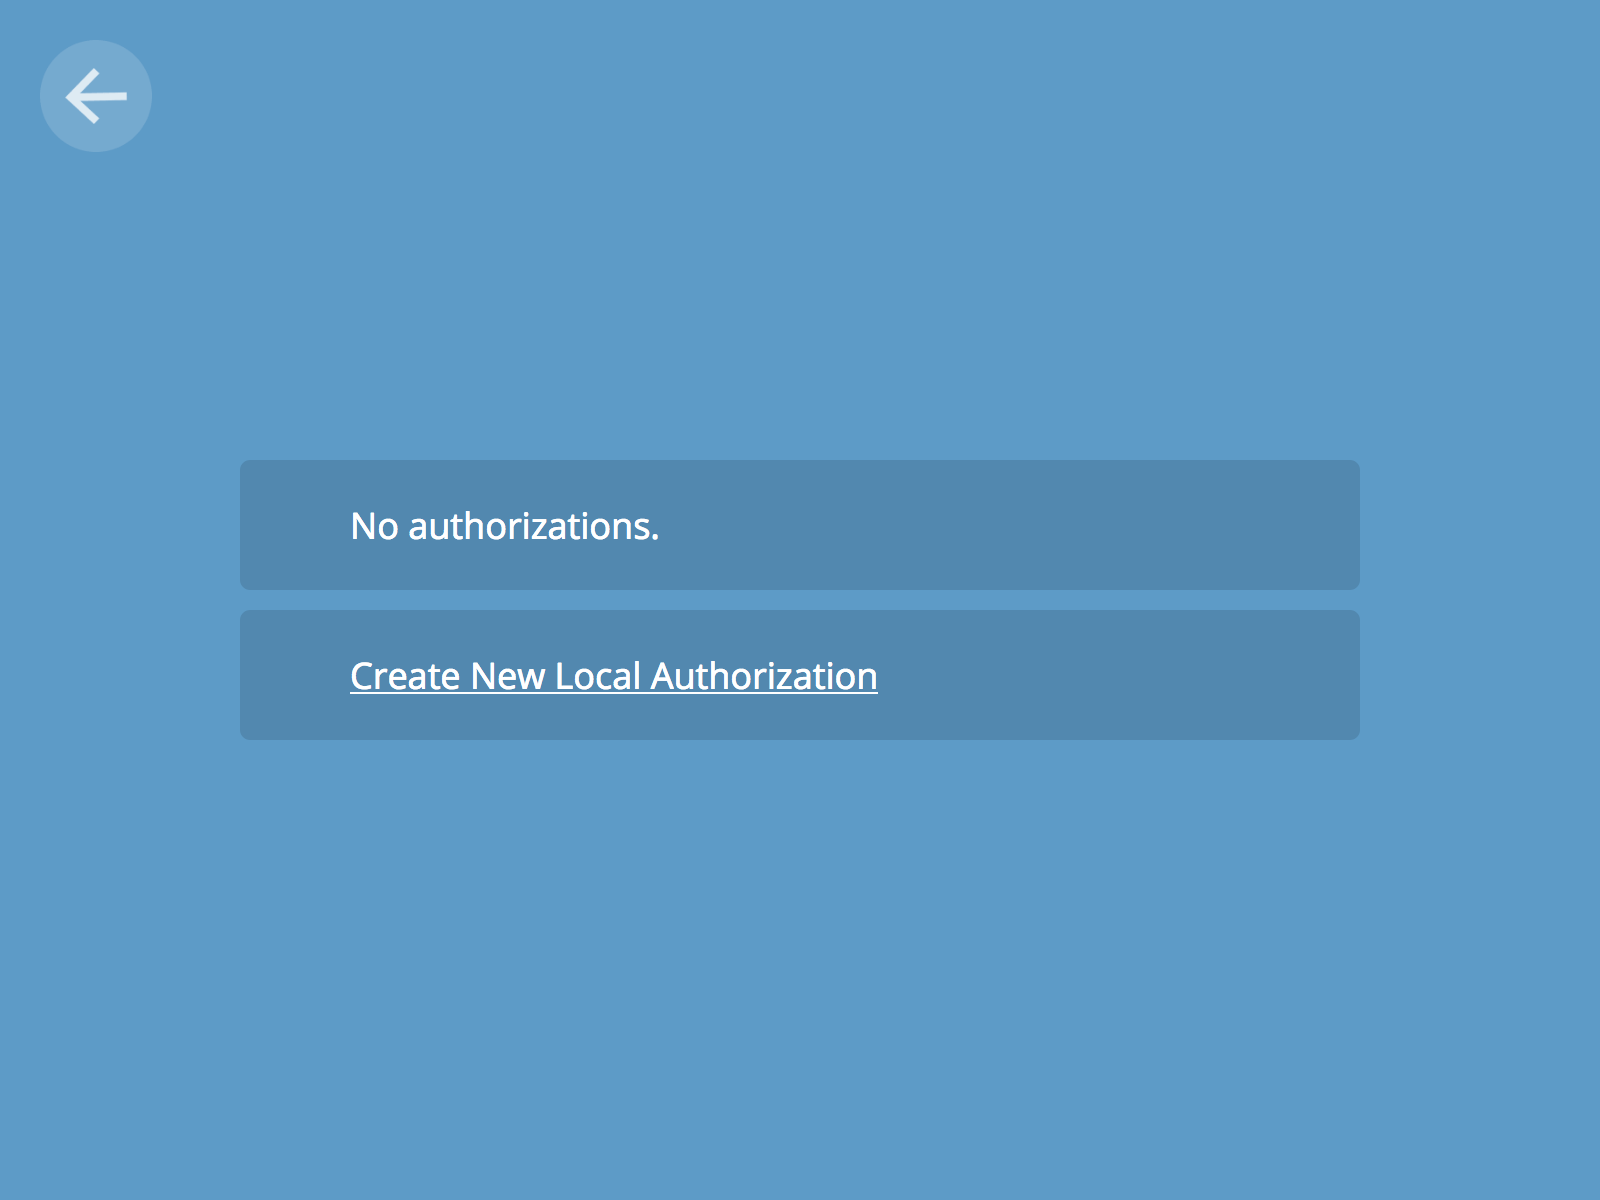
Next, enter the Authorization section and create a new local authorization.
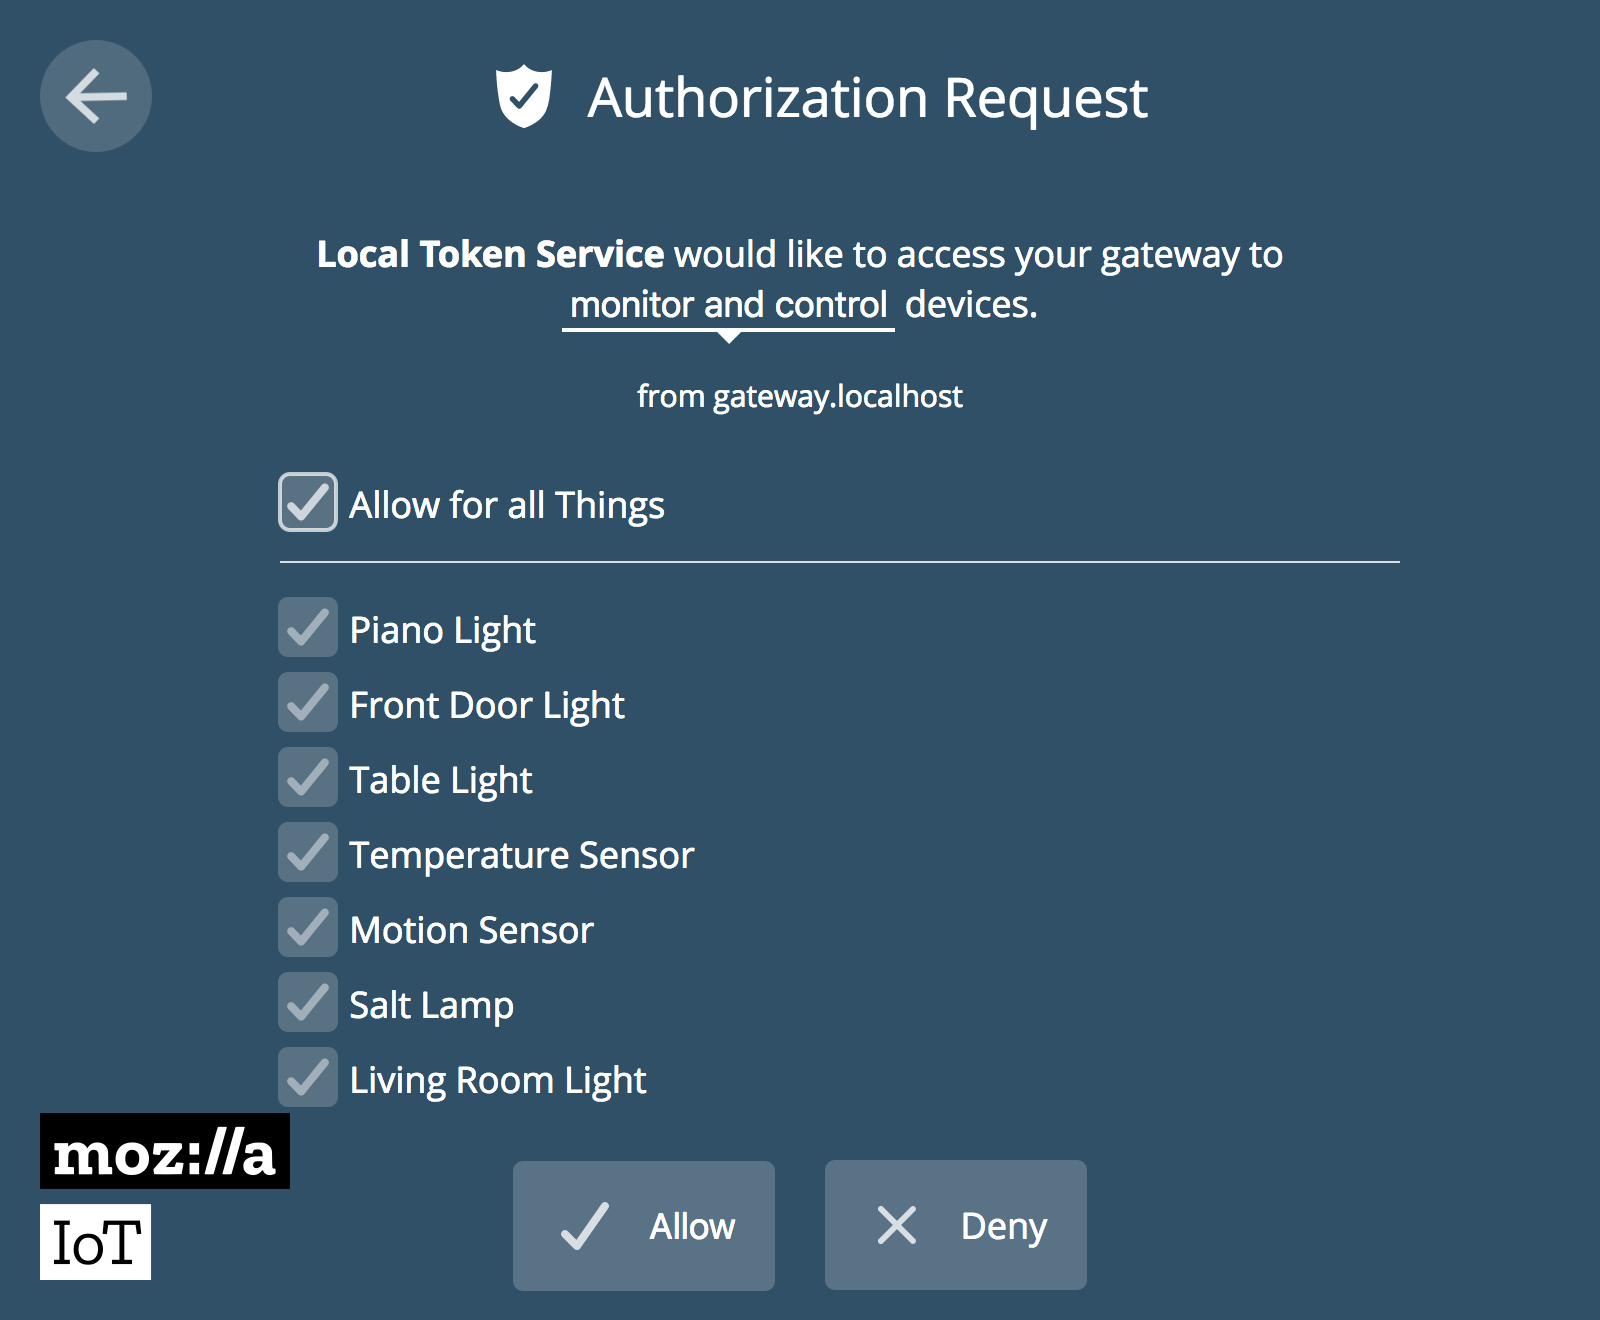
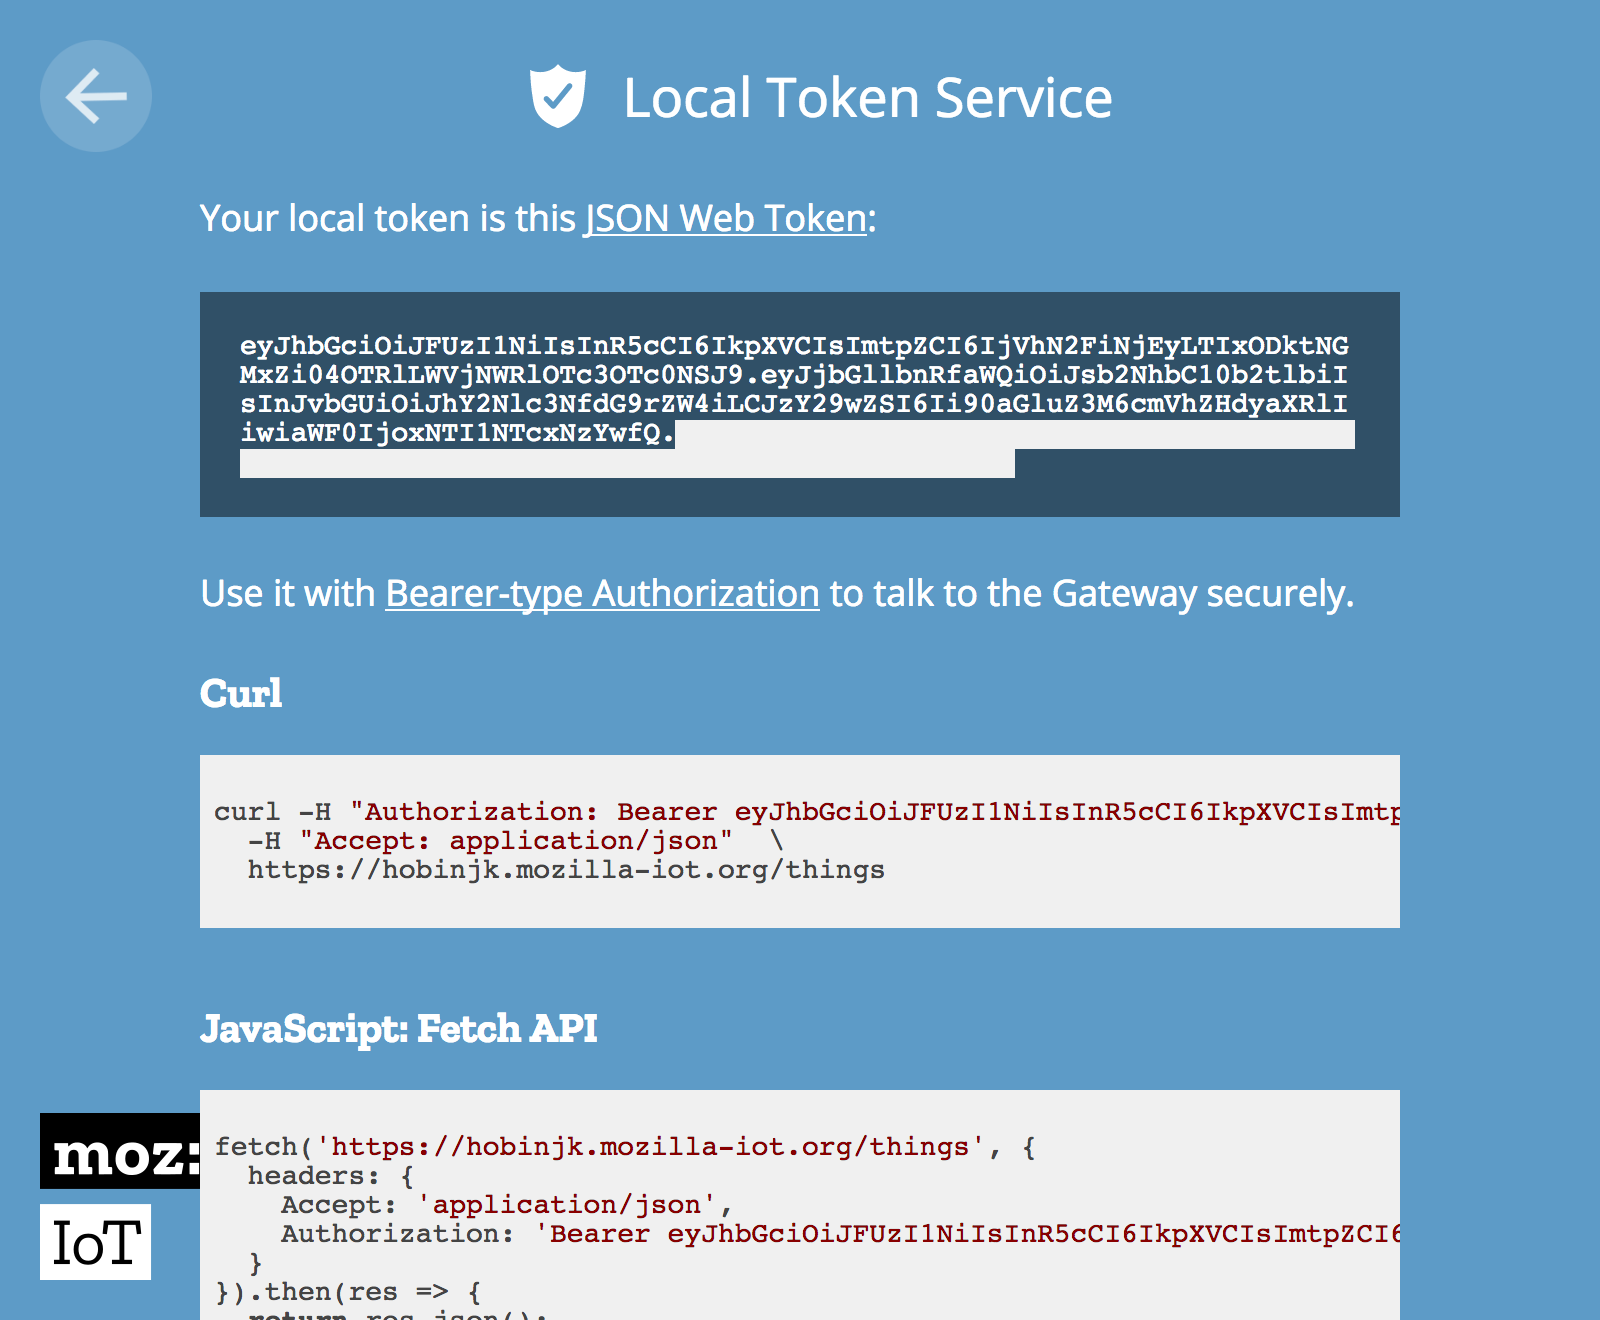
Allow the authorization request and copy the local token issued by the Local Token Service. This is the identification card the translator will present to the gateway to confirm its identity.
Our translator is fully kitted out and ready to embark on its expedition to harvest the secrets of the Web Thing API. For now, let’s just run it using the following command:
node translator.js "https://your-domain-here.mozilla-iot.org" "paste the local token here"If you can visit http://gateway.local:3060/metrics and see a lot of text and numbers, you’re good to go. Otherwise, check out the troubleshooting section of the translator’s GitHub repo.
Installing Prometheus
Second, let’s install and configure Prometheus by running the following commands:
sudo apt install prometheus
sudo cp ~/mozilla-iot/gateway-prometheus-translator/prometheus.yml /etc/prometheus/
sudo systemctl stop prometheus
# Clear all existing metrics (don’t typo this!)
sudo rm -r /var/lib/prometheus/metrics
sudo systemctl start prometheus
Graphing all the Things!
Now let’s kick back and enjoy the graphs. If we visit http://gateway.local:9090, we can draw graphs and run queries on our historical thing data. For starters, we can get a simple graph of any thing’s property value by clicking on “insert metric at cursor” and selecting the property we want to graph. In my case, I first selected my smart plug’s voltage as a sanity check.
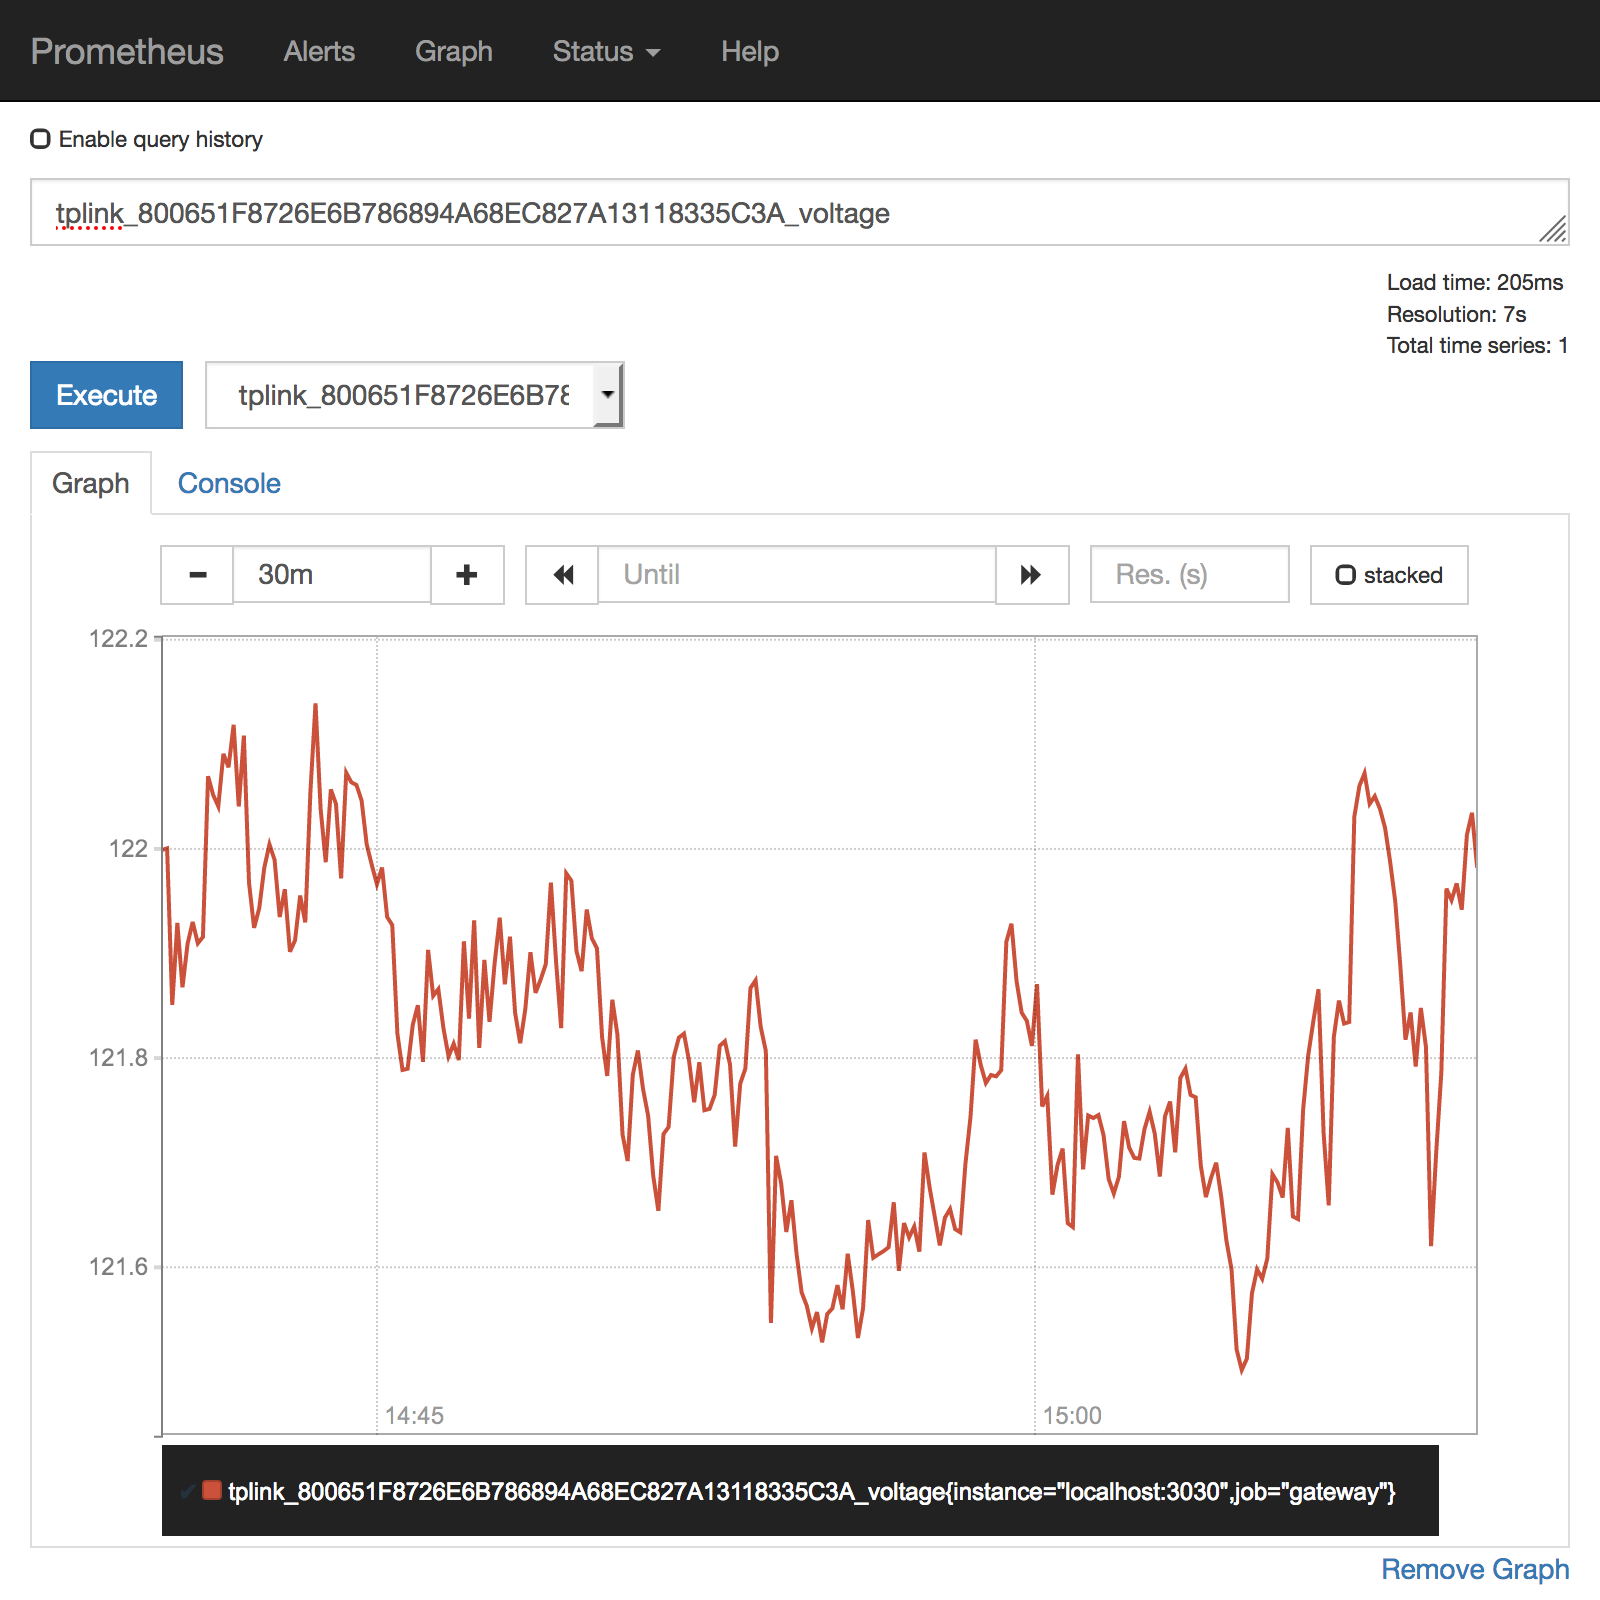
In the United States 120 volts AC is the accepted standard for household voltage so we’re in the clear with a few extra volts to spare.
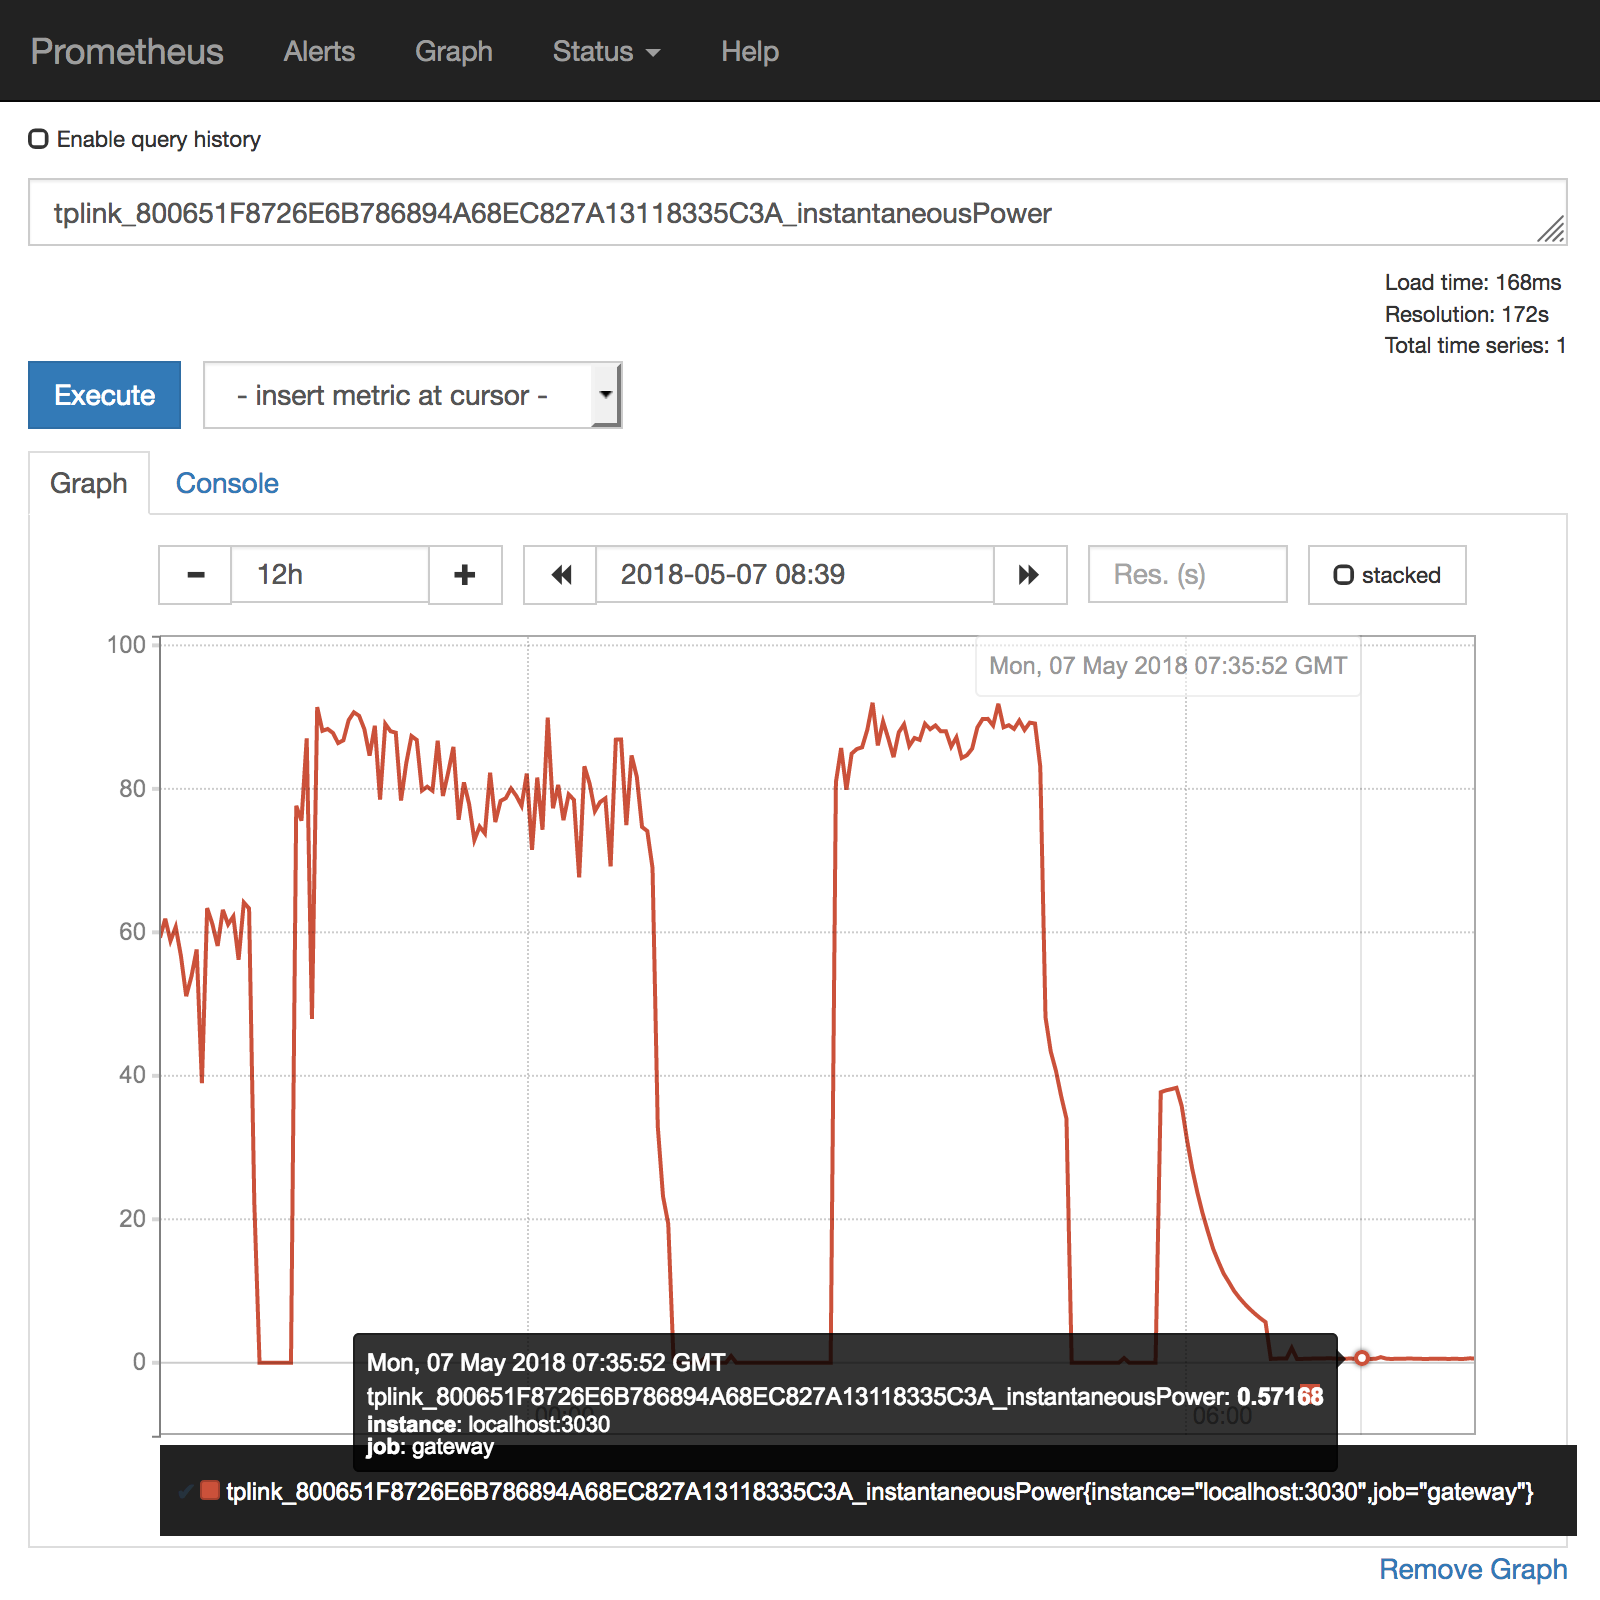
Let’s dive a bit deeper and find out how much power my laptop charger consumes over a typical day. For this we want the instantaneousPower metric. Here you can see clear differences based on whether my laptop is plugged in and whether it’s performing a strenuous task. At around 05:00 on the graph I plug in my laptop and go to sleep (note that all times are in GMT, not my local time zone). The laptop charges to full, displaying some fancy trickle-charge style ramping down of power consumption towards the end.

One insight I wanted to get from this graph is how much power I waste by leaving my laptop charged through the night. From the graph, I can see that the charger consumes around 0.6 watts while keeping my laptop fully charged. Assuming I sleep for 8 hours, this means that it consumes 4.8 watt-hours of power. Factoring in the average cost of electricity, over an entire month this costs me 0.14 kilowatt-hours which corresponds to the princely sum of two cents. I can sleep easy knowing that it doesn’t matter whether my laptop is plugged in.
This only scratches the surface of what’s possible with Prometheus consuming the Web Thing API. From this point we can perform all the advanced queries Prometheus supports. For example, over the last 24 hours the average power consumption of my charger was 38 watts.
We can also configure alerts, set up a shinier graphing frontend, or export our data to external storage. To make this setup permanent, follow the translator’s installation instructions.
The Bright Future
We’re looking at integrating this time-series functionality with the gateway on a lower level to make this kind of cool analytics easier for people to access. Our goal is to build a homogenous graphing platform optimized for the Web Thing API.
We want to make the Web of Things accessible and open to all. If you want to help, participate in our planning on GitHub at the time-series tracking issue. You could also build translators for other analytics tools like Huginn or Munin.
About James Hobin
Level 25 Computer Wizard on a quest to keep the Internet of Things free and open.