
Building and debugging modern JavaScript applications in Firefox DevTools just took a quantum leap forward. In collaboration with Logan Smyth, Tech Lead for Babel, we leveled up the debugger’s source map support to let you inspect the code that you actually wrote. Combined with the ongoing initiative to offer first-class JS framework support across all our devtools, this will boost productivity for modern web app developers.
Modern JS frameworks and build tools play a critical role today. Frameworks like React, Angular, and Ember let developers build declarative user interfaces with JSX, directives, and templates. Tools like Webpack, Babel, and PostCSS let developers use new JS and CSS features before they are supported by browser vendors. These tools help developers write simpler code, but generate more complicated code to debug.
In the example below, we use Webpack and Babel to compile ES Modules and async functions into vanilla JS, which can run in any browser. The original code on the left is pretty simple. The generated, browser-compatible code on the right is much more complicated.

Figure 1. Original file on the left, generated file on the right.
When the debugger pauses, it uses source maps to navigate from line 13 in the generated code to line 4 in the original code. Unfortunately, because pausing actually happens on line 13, it can be difficult for the user to figure out what the value of dancer is at that time. Moving the mouse over the variable dancer returns undefined and the only way to find the scope of dancer is to open all six of the available scopes in the Scopes pane followed by expanding the _emojis object! This complicated and frustrating process is why many people opt to disable source maps.
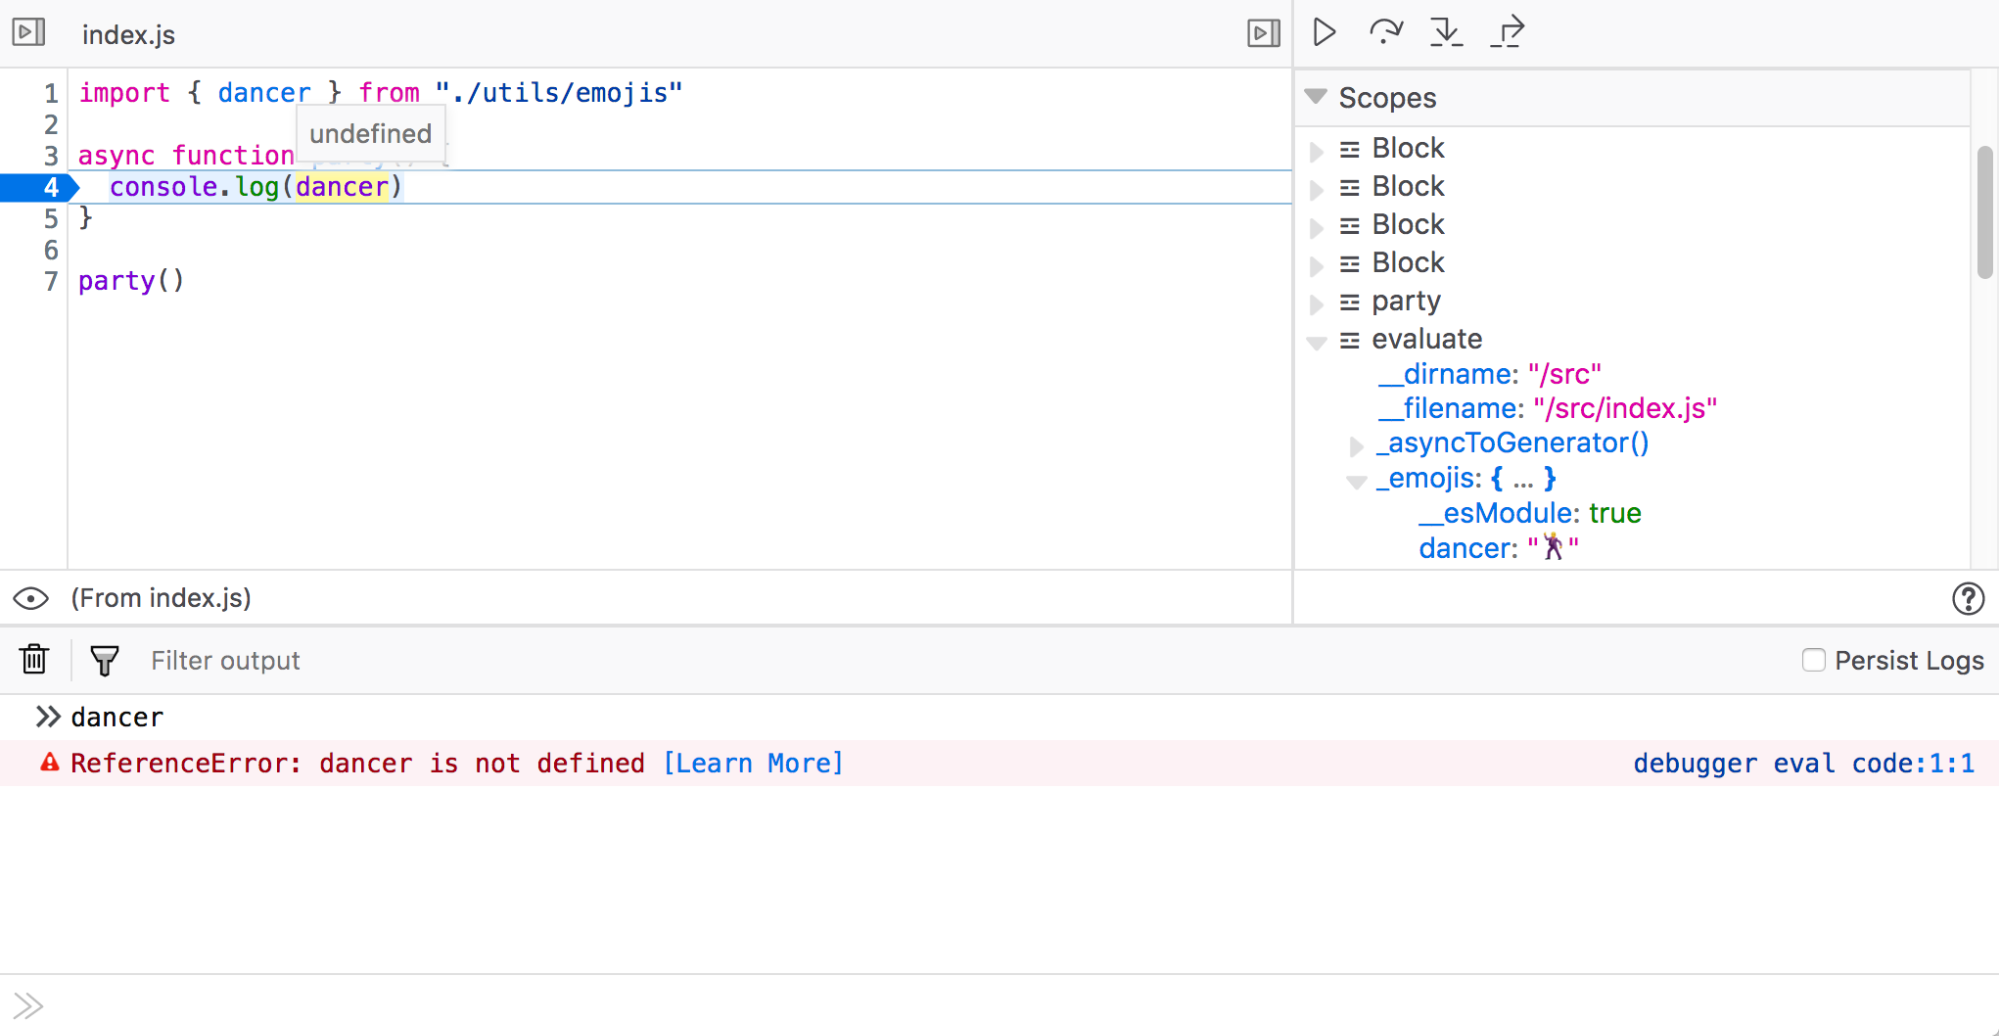
Figure 2. Value of dancer is undefined, six separate scopes in the Scopes pane.
To address this problem we teamed up with Logan Smyth to see if it was possible to make the interaction feel more natural, as if you were debugging your original code. The result is a new engine that maps source maps data with Babel’s syntax tree to show the variables you expect to see the way you want to see them.
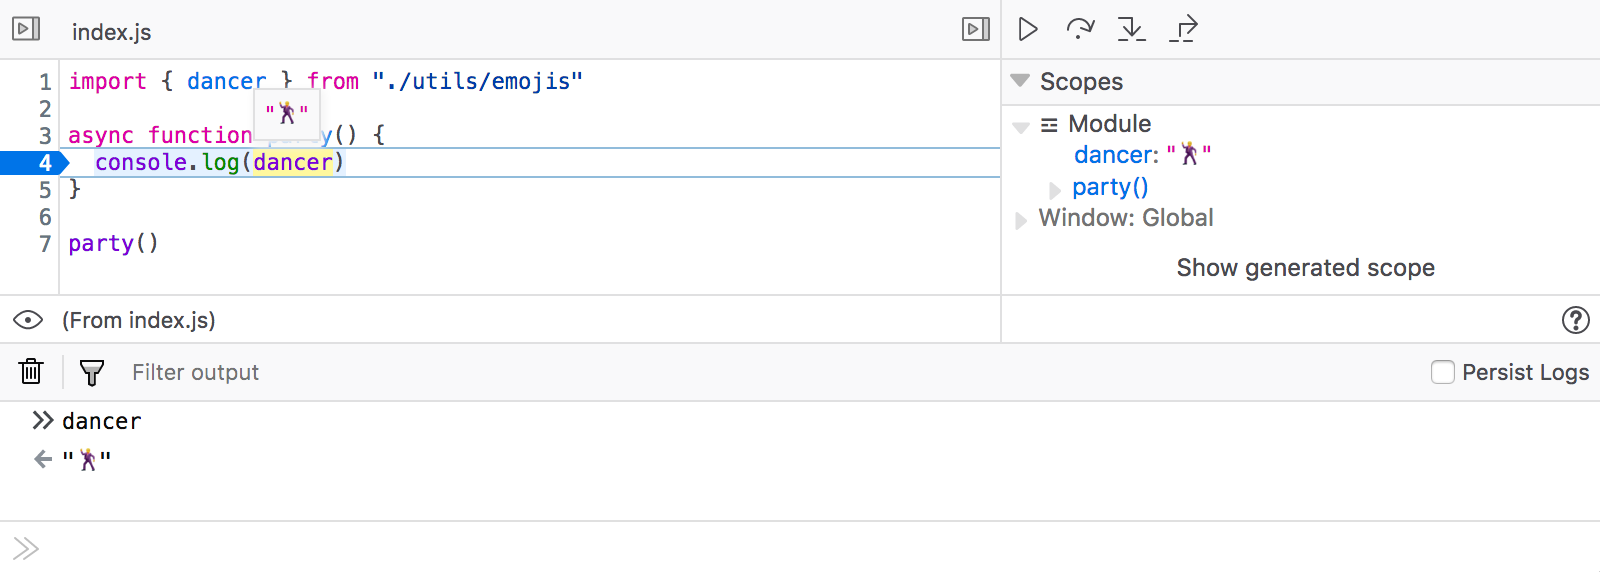
Figure 3. Correct value of dancer is displayed, Scopes pane shows one scope.
These improvements were first implemented for Babel and Webpack, and we’re currently adding support for TypeScript, Angular, Vue, Ember, and many others. If your project already generates source maps there is a good chance this feature will work for you out of the box.
To try it out, just head over and download Firefox Developer Edition. You can help us by testing this against your own project and reporting any issues. If you want to follow along, say hello, or contribute, you can also find us on the devtools channel Github or Mozilla Discourse or in the devtools Slack!
Our 2018 goal is to improve the lives of web developers who are building modern apps using the latest frameworks, build tools and best practices. Fixing variables is just the beginning. The future is bright!
About jlaster
Staff Engineer on Firefox Developer Tools devving the DevTools and debugging the debugger.
About Harald Kirschner (digitarald)
Harald "digitarald" Kirschner is a Product Manager for Firefox's Developer Experience and Tools – striving to empower creators to code, design & maintain a web that is open and accessible to all. During his 8 years at Mozilla, he has grown his skill set amidst performance, web APIs, mobile, installable web apps, data visualization, and developer outreach projects.
6 comments