
Firefox 57 Developer Edition was just released! It’s such an advance that we’ve given this browser a new name: Firefox Quantum. This is a great opportunity to tell you about what the DevTools team has been up to since our last major update back in March.
DevTools visual update
Say hello to a complete visual refresh of both our Light and Dark themes, matching the new visual style of Firefox Quantum. (We call this UI Photon.) The new design is simpler, cleaner and has better contrast. We also updated all the syntax highlighting colors to improve text readability. Check out this in-depth blog post at Firefox Nightly News by our UX Designer Victoria Wang for more details and research that went into choosing just the right colors.
Inspector
CSS Grid is taking over the web, and DevTools are here to help you master grids. Head over to the new Layout panel in the Inspector, where the CSS Grid widget lists all of the grid containers on the page. The grid overlays have also been improved: they now show line numbers, area names and adapt to the most complex CSS transforms.
Ever been bugged by a DOM element showing up in an unexpected spot? The Layout panel shows detailed box-model information, with all properties relevant to positioning, including the offset parent.
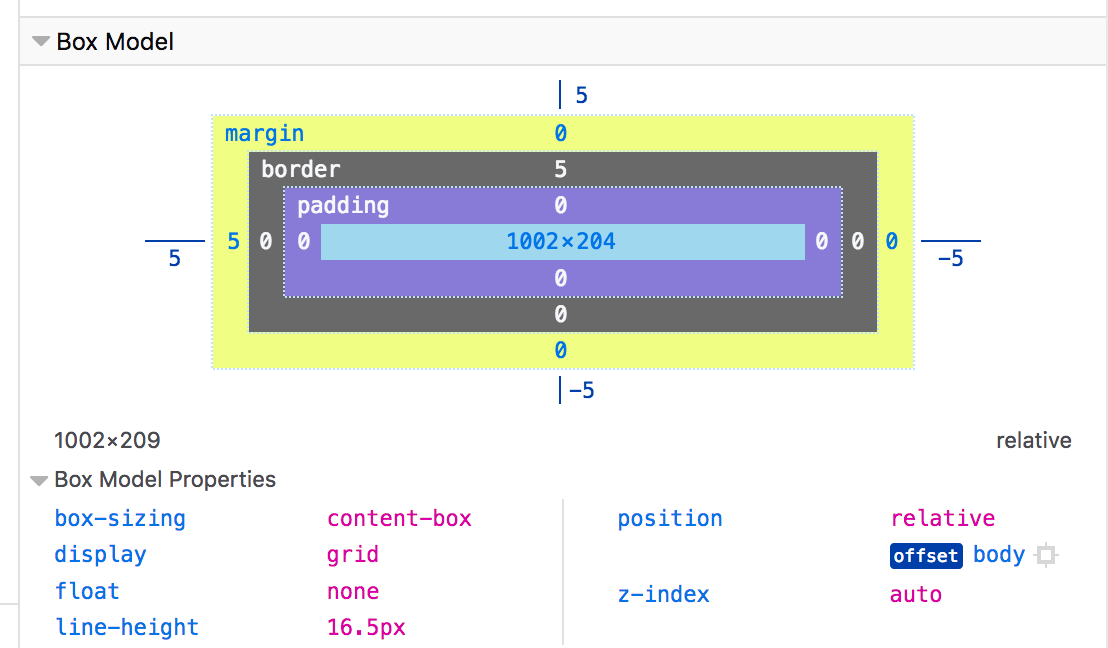
There are too many goodies in the Layout panel to list here, so have a look at this recent post covering the layout panel in the new Inspector.
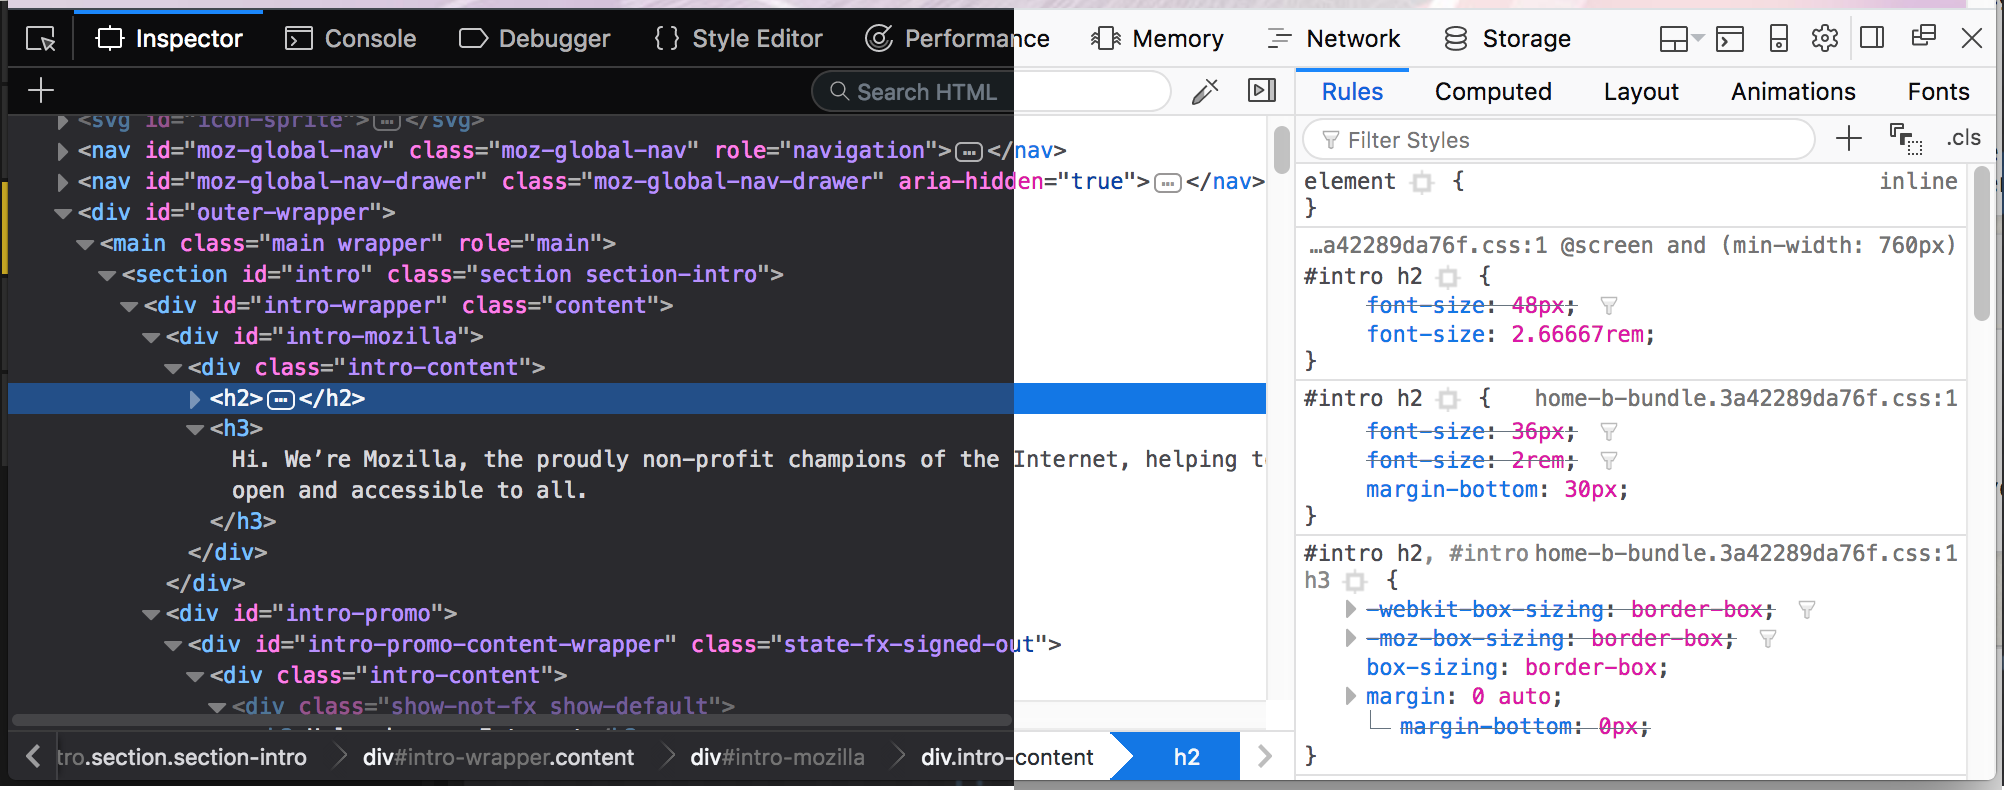
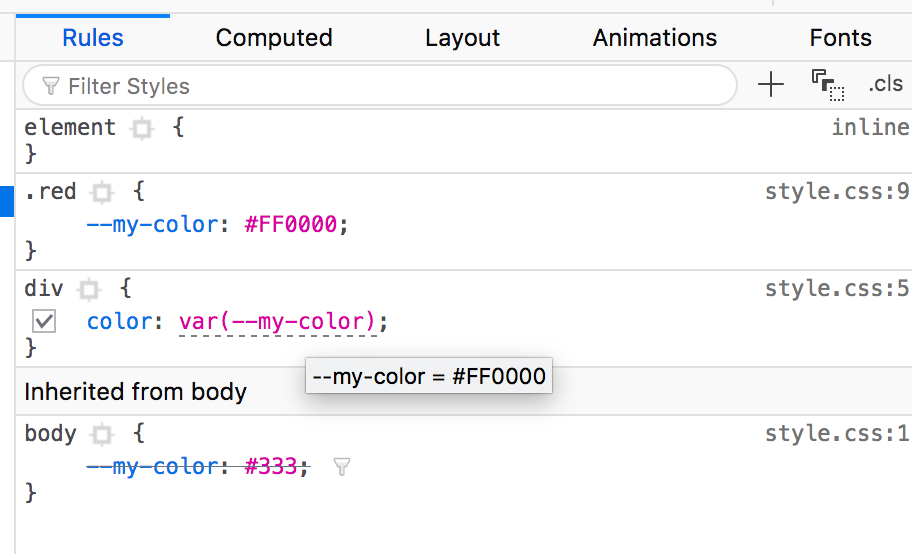
CSS Variables are now widely supported and ready to be used in the wild! The Inspector shows the current value of a variable on hover. It also explains why a variable has a given value for the selected element.
It’s super-useful to be able to add, remove, and togge classnames when debugging CSS. Now you can easily do this from the Inspector. Click on the “.cls” button to reveal all of the classes applied to the selected element. You can toggle any of them or add new ones.
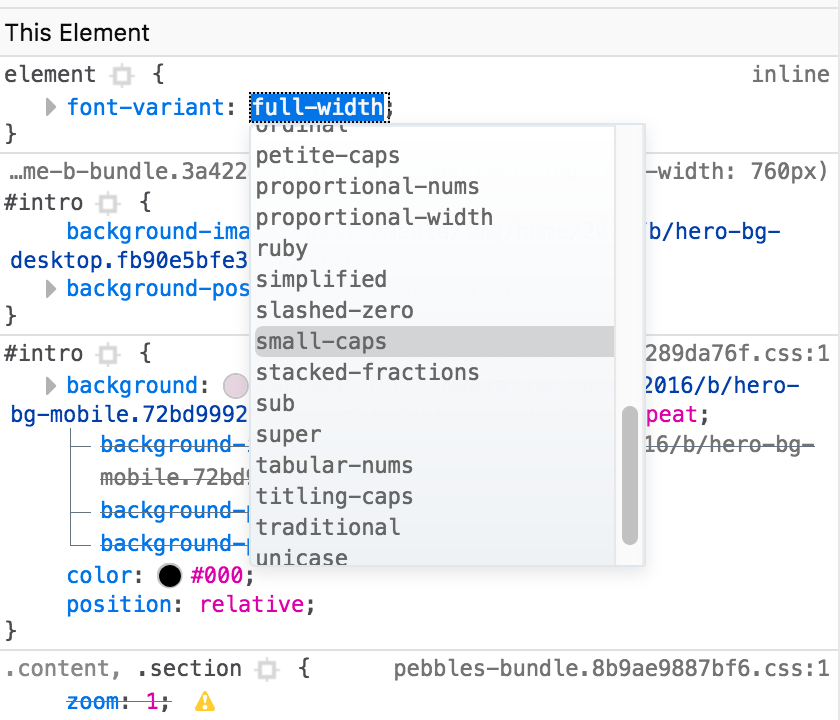
Don’t remember all the possible values possible for font-variant? That’s ok, you shouldn’t have to! Our CSS auto-completion now returns many more values.
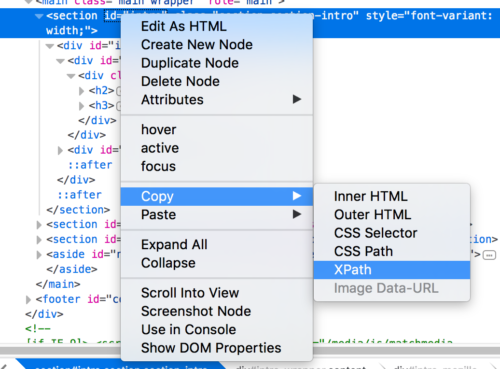
I want to highlight one last feature of the Inspector. If you work with test automation tools, you will like the new Copy XPath context-menu option. This feature used to be in Firebug, and we are really glad to bring it back to DevTools!
Console
We are shipping a new Console UI in Firefox Quantum (Firefox 57)! Joining the Debugger and the Network Monitor, the Console has been rewritten using modern web technologies such as React and Redux. Looking forward to your feedback!
The new Console allows you to inspect objects in context. When an object is logged in the console, you can simply expand it and explore its contents. Existing features of the previous UI, such as filters and network request details, have also been ported to this new front-end.

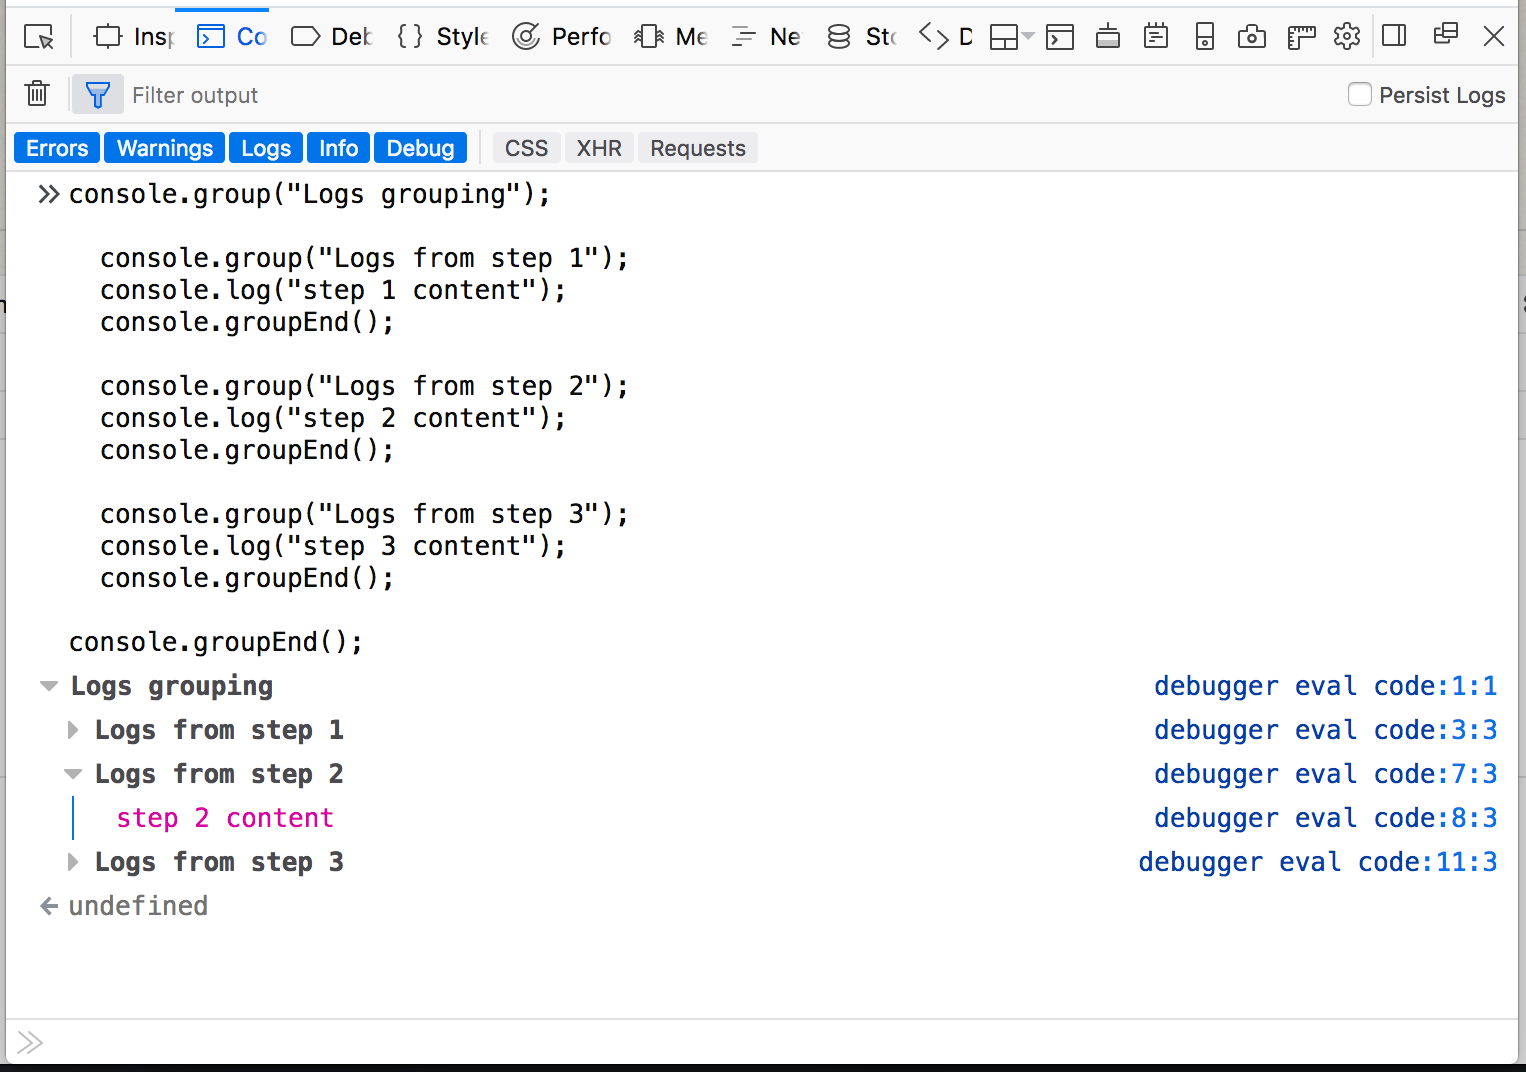
Console.group() and groupCollapsed() are super useful to make your logs more organized and readable. Modern frameworks’ loggers nicely group & format bursts of updates. You can now collapse log groups to see only what matters to you.
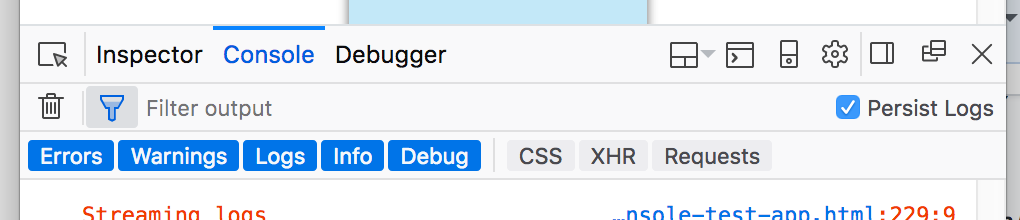
Did you know you could persist logs when navigating from page to page? The “Persist Logs” checkbox is now much easier to find, directly in the Console panel.
Debugger
Thanks to all the feedback received since the new Debugger was first released on Developer Edition, we are shipping it to all channels with Firefox 56. Thanks again for your help, let’s take a look at the main new features.
Outline View & Function Search

Debugging is often about finding the right method. The new debugger features an outline view, with links to all the methods defined in the current source. If you prefer searching, you can also use function search and quickly jump to any function.
Project Search
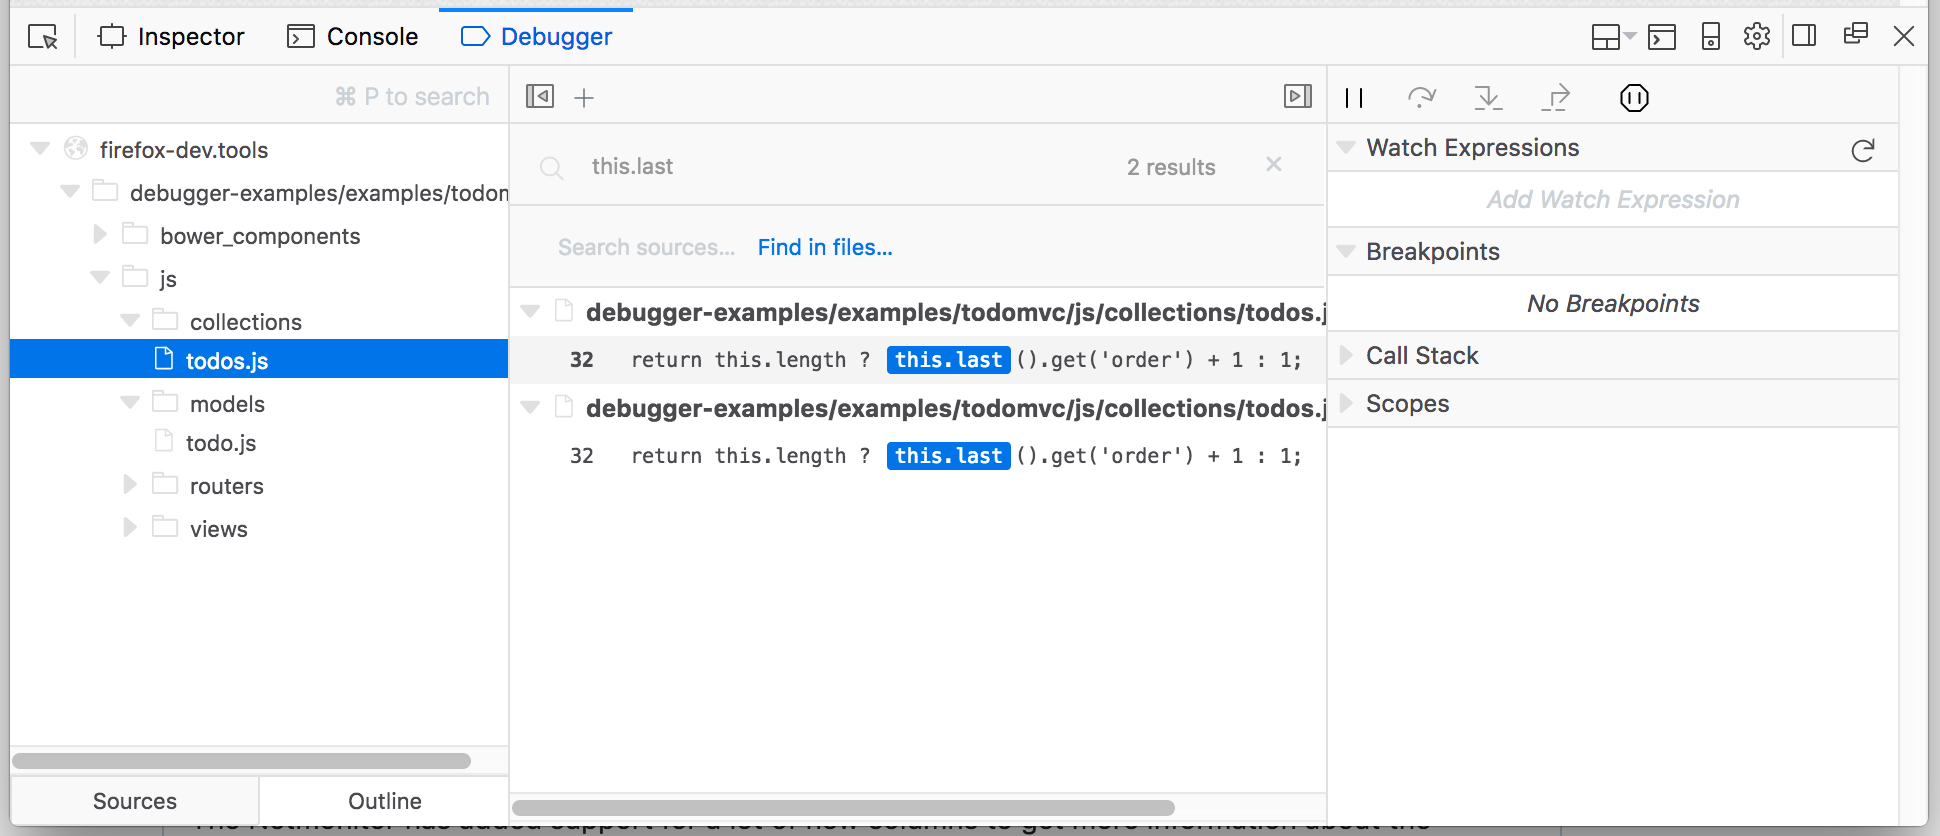
Speaking of search, the new Debugger introduces project search, a.k.a. “Find in all files”. Pretty useful if you need to find where this alert (“foo”) is coming from. This was one of our top requested features, we are very happy to ship it in Firefox 57.
Collapsed Framework Callstacks

Frameworks and libraries are everywhere in the Web landscape, and Firefox Developer Tools embrace this! The debugger now displays matching icons in callstacks for framework sources. Framework methods are also collapsed by default in callstacks, so no need to scroll through foreign method calls anymore. You can also enable blackboxing to completely forget about a file and never have to step through it.
Pinned (AST) Breakpoints
With pinned breakpoints, the Debugger will keep track of your breakpoints even when the code changes. You can move methods in your source files, and breakpoints will automatically stay on the correct statements.
Async Stepping
Async & await will change the way we write asynchronous code for the better. The Debugger can now seamlessly step-over or step-in with async functions.
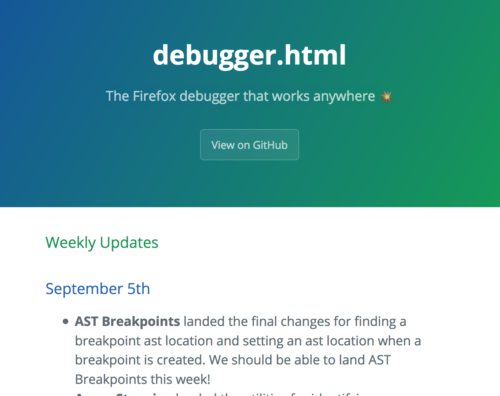
If you want to follow more closely the (very active!) development of the Debugger, you should check out the weekly updates published by the team.
Source maps
Babel, SCSS, WebAssembly, TypeScript… Compiling JS and CSS is now common practice. As a result, the code that the browser uses looks pretty different from the original source files. We finally support sourcemaps in all our major tools, so you can focus on working with your original files.
Network Monitor
Scheme, timings, headers… Here are just some of the new Netmonitor columns! You can choose your own set of columns to see only what you want. The filter input also provides auto-completion based on the column names, to build powerful filter queries.
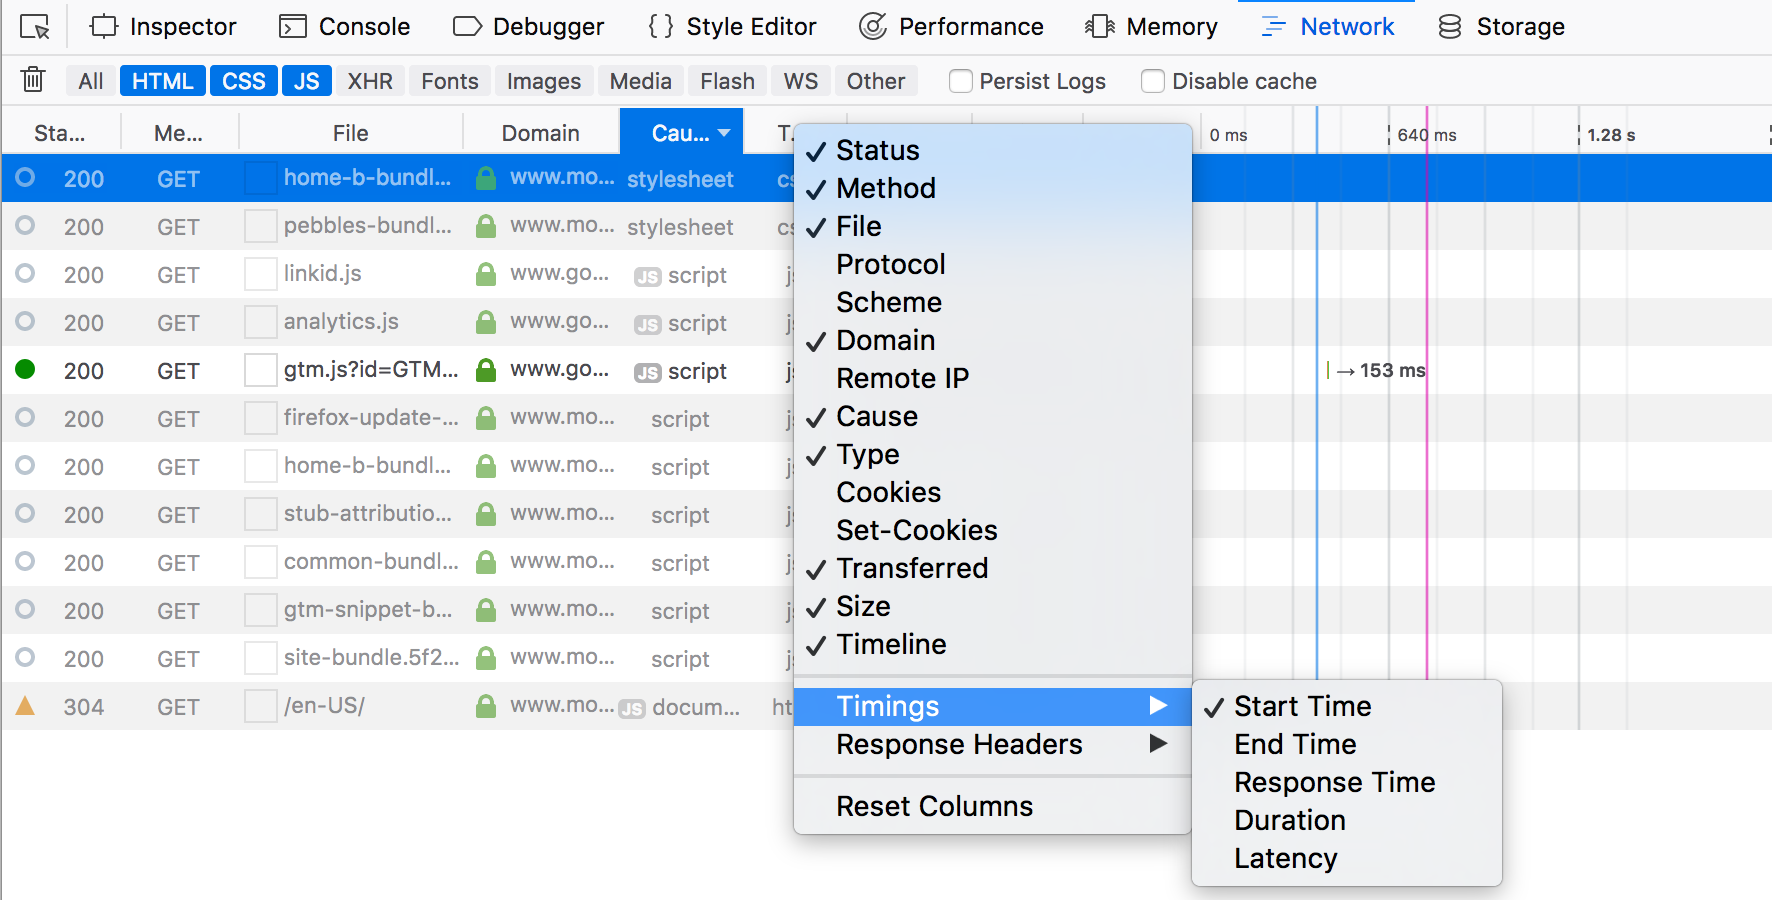
What does the ETag header mean? What is status code 502? The Netmonitor now links to MDN Web Docs to help you learn about request & response headers, status codes, timings etc…

Timings for DOMContentLoaded and load are crucial when analyzing the performance of a website. They are now clearly visible in the new status bar, next to the requests’ summary.

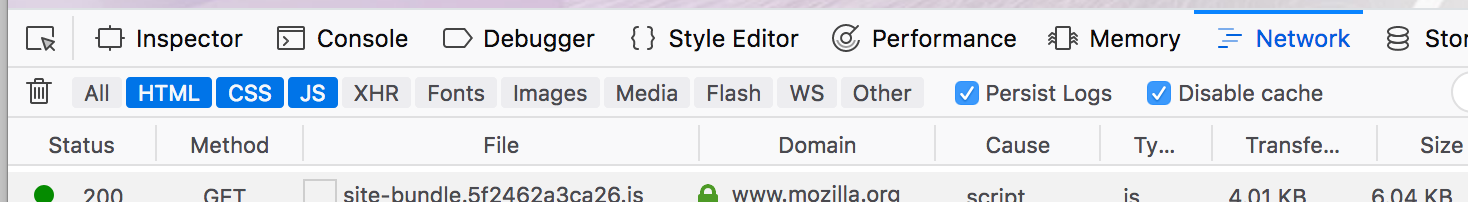
You can now toggle “Persist Logs” and “Disable cache” right from the Network Monitor UI. This is super handy when you need to inspect a POST request that triggers a page navigation!
Storage Inspector
Tired of typing localStorage.setItem in the Console? You can now add new cookies or localStorage entries directly in the Storage Inspector.
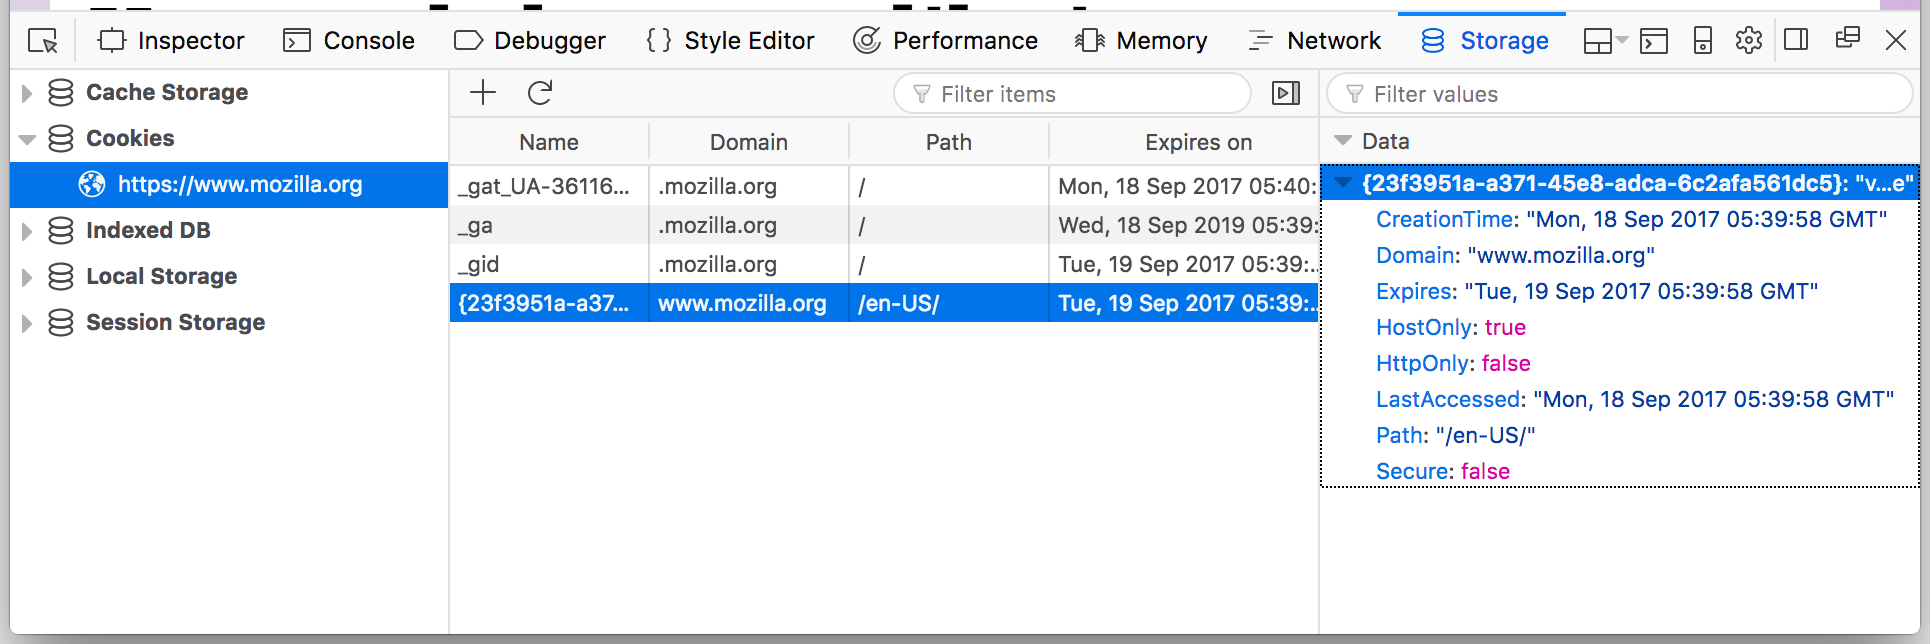
Last but not least, the Storage Inspector is now enabled by default for all channels!
Thanks everyone!
That was a long read, thanks for reading to the end. We hope you will enjoy the new features we are rolling out. Feedback welcome, find us on Slack or on #devtools at irc.mozilla.org. And a HUGE thank you to all the contributors: You are doing an amazing job on DevTools:
- Abhinav Koppula
- Adrien Enault
- Adrien Pachkoff
- Ahmed Towkir
- anejaalisha
- Bomsy (Hubert B Manilla)
- Brennan Brisad
- Christopher Phonis-Phine
- Eric Skoglund
- Espen Henriksen
- Gabrielle Singhcadieux
- Hemant Singh
- Henri Kemppainen
- Hossain Al Ikram
- Jaideep Bhoosreddy
- Leonardo Couto
- Locke Chen
- Maxwell
- Mayank
- Micah Tigley
- Michael Kohler
- Mike Park
- Mohammed Yaseen Khan
- nbeltran14
- Tim Nguyen
- Nick Fox
- Nicolas Ouellet-Payeur
- Oriol Brufau
- Pinkney
- Ragnis
- Rahul Chaudhary
- Ruben Schmidmeister
- Ruturaj Vartak
- Santiago Paez
- Sebastian Zartner
- Sheldon Roddick
- Stanford Lockhart
- Stefan Yohansson
- Stoyan Dimitrov
- Stylizit (Matt R)
- Swapnesh Kumar Sahoo
- Vangelis Katsikaros
- Vera
- Vincent Lequertier
- Xavier ALT
16 comments