
A-Frame makes building 3D and VR web applications easy, so developers of all skill levels can create rich and interactive virtual worlds – and help make the web the best and largest deployment surface for VR content. For an Oregon State University capstone project focused on WebVR, our team investigated performance and optimizations for A-Frame on Android smartphones. We developed a means of benchmarking the level of 3D complexity a mobile phone is capable of, and determining which performance metrics are required for such a benchmark.
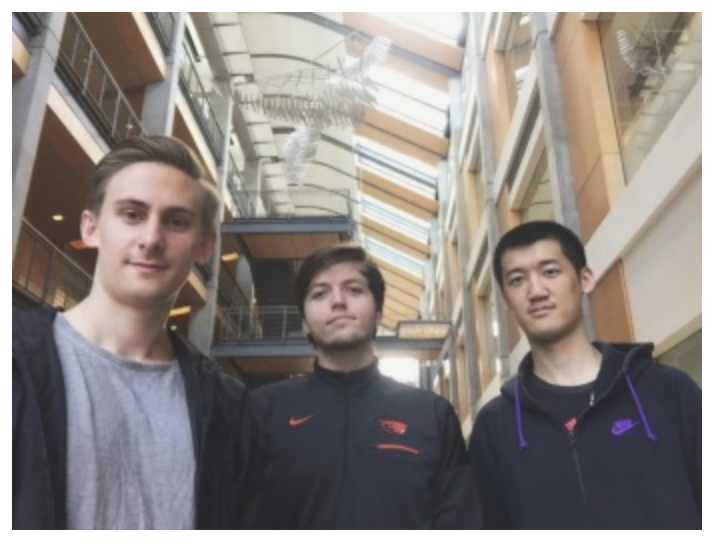
From the left, Team OVRAR (Optimizing Virtual Reality and Augmented Reality):
Branden Berlin: Javascript Compatibility and Model Lighting
Charles Siebert: Team Captain, Project Designer, and Modeling
Yipeng (Roger) Song: Animations and Texturing
Results and Recommendations
Texture size: The framework resizes textures to the nearest power of two, which heavily increases the loading and rendering workload in the scenes. We found that high-resolution textures that didn’t match the criteria reached sizes of 8196×8196, with one texture taking up to 20 MB! Using texture dimensions that are a power of two helps ensure optimal memory use. Check the Web Console for warnings when textures are resized.
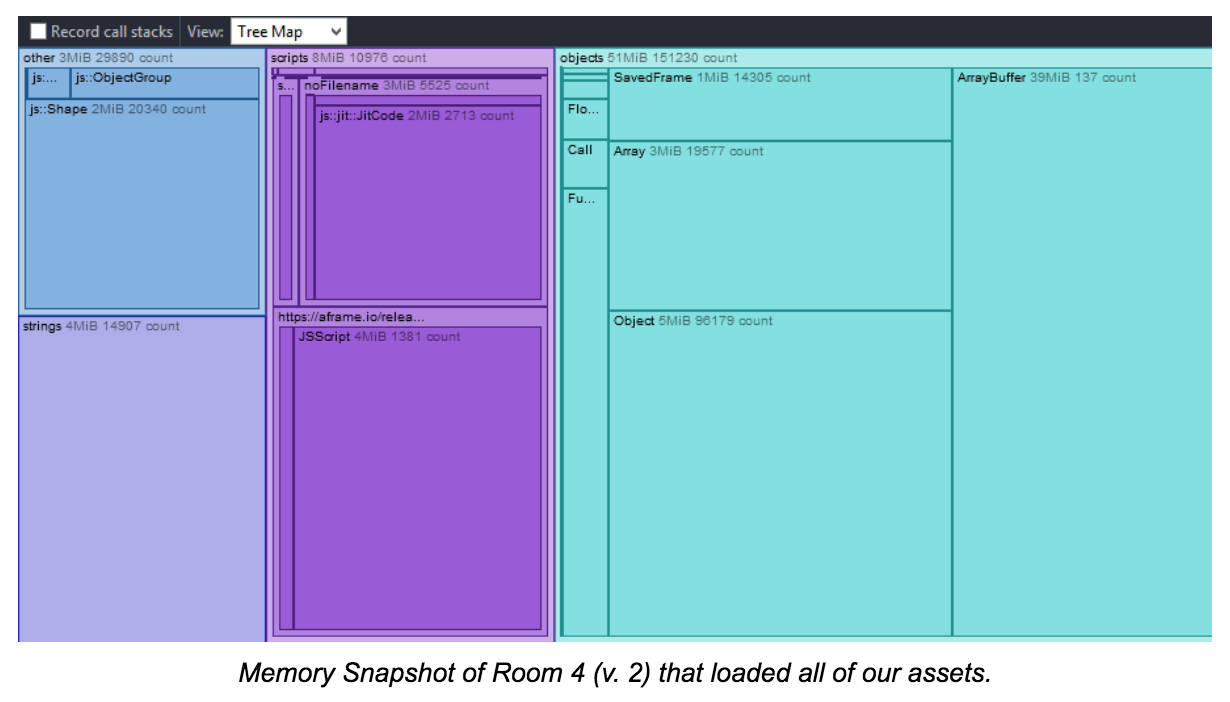
Asset Limit: We found that having more than 70 MB of assets loaded for one web page was unrealistic in a phone environment. It caused significant delays in loading the scene fully, and in some cases crashed the browser on our phones. Use the Allocations recorder in the Performance Tool in Firefox to check your scene’s memory usage, and the A-Frame Inspector to tune aspects of rendering for individual objects.
Resolution cost: Higher resolution trees caused delays in loading the models and significant slowdowns in rendering the scenes. Our high resolution tree features 37,000 vertices which increases the graphics rendering workload, including lighting from multiple light sources. This heavily limited the number of models we could load into our scene. We also found an upper limit for our devices while handling these trees: When our room reached about 1,000,000 vertices, our phone browsers would crash after spending a few minutes attempting to load and render. You can add the “stats” property to your tag to see the number of vertices in the scene.
Object count: Load times increased linearly based on the number of models to be drawn to the scene. This would add a significant amount of time, if each object to be loaded took, for example, three milliseconds. Further inspecting the memory snapshot shows that our object models are read in and stored into object arrays for quicker access and rendering. Larger object models would also increase linearly based off the number of vertices and faces that are used to create the model, and their resulting normal vectors. Check the A-Frame stats monitor to keep an eye on your object count.
Measurement overhead: During the testing, we used WebIDE to monitor on-device performance. We found that the overhead of USB debugging on our Android devices caused performance to drop by nearly half. Our testing showed that CPU performance was not the leading bottleneck in rendering the scenes. CPU usage hovered at 10-25% during heavy performance drops. This shows that the rendering is mostly done on the GPU, which follows how OpenGL ES 2.0 operates in this framework.
Testing Approach
Our approach was to:
- render multiple scenes while measuring specific metrics
- determine the best practices for those metrics on mobile
- report any relevant bugs that appear.
The purpose of creating a benchmark application for a mobile device is to give a baseline for what is possible to develop, so developers can use this information to plan their own projects.
We tested on the LG Nexus 5X and used the WebIDE feature in Firefox Nightly to pull performance statistics from the phone while it was rendering our scenes, tracking frames-per-second (FPS), and using memory. Additionally, we tracked processor usage on the device through Android’s native developer settings.
To begin, we broke down the fundamental parts of what goes into rendering computer graphics, and created separate scenes to test each of these parts on the device. We tested object modeling, texturing, animation, and lighting, and then created standards of performance that the phone needed to meet for each. We aimed to first find a baseline performance of 30 FPS for each part and then find the upper bound – the point at which the feature breaks or causes visual drops in performance. We separated these features by creating a VR environment with four “rooms” that tested each in A-Frame.
Room 1: Loading object models using obj-loader
In the first room, we implemented a high-resolution tree, loading a large number of low vertice-count objects and comparing to a low number of high vertice-count objects. Having a comparable number of vertices rendered in either scene helped us determine the performance impact of loading multiple objects at once.
Room 2: Animations and textures
In this room, we implemented textures and animations to determine the impact on initial load times and the impact in calculating animation methods. We used A-Frame’s built-in functions to attach assets to objects to texture them, and we used A-Frame’s animation methods to animate the objects in this room. This allowed us to easily test this scenario of animating the textured objects and measure the differences between the two iterations. In the first iteration, we implemented low-resolution textures on objects to compare them with high-resolution textures in the second iteration. These resolution sizes varied from 256×256 to 8196×8196. We also wanted to compare the performance between the two rooms, and see if texturing the objects would cause any unforeseen issues with animations other than the initial load time when downloading the assets from the web page.
Room 3: User interaction and lighting
This room’s initial concept focused on the basis of gaming: user interaction. We utilized JavaScript within A-Frame to allow the user to interact with objects scattered about a field. Due to the limited mobility of mobile-VR interaction, we kept it to visual interaction. Once the user looked at an object, it would either shrink or enlarge. We wanted to see if any geometric change due to interaction would impact hardware demand. We manipulated the growth size of object interactions and found a few unreliable stutters. Generally, though, the hardware performance was stable.
For the second iteration, we ramped up the effects of user interactions. We saw that nothing changed when it came to physical effects on objects in the world, so we decided to include something that is more taxing on the hardware: lighting.
As the user interacted with an object, the object would then turn into a light source, producing an ambient light at maximum intensity. We scattered these objects around the room and had the user turn them on, one by one. We started with 10 ‘suns’ and noticed an initial lag when loading the room, as well as a 2-3 second FPS drop to 13, when turning on the first sphere. After that, the rest of the spheres turned on smoothly. We noticed a steady and consistent drop of about 10 FPS for every 10 max-intensity light sources. However, as the intensity was decreased, more and more lighting sources were allowed before a noticeable change in performance occurred.

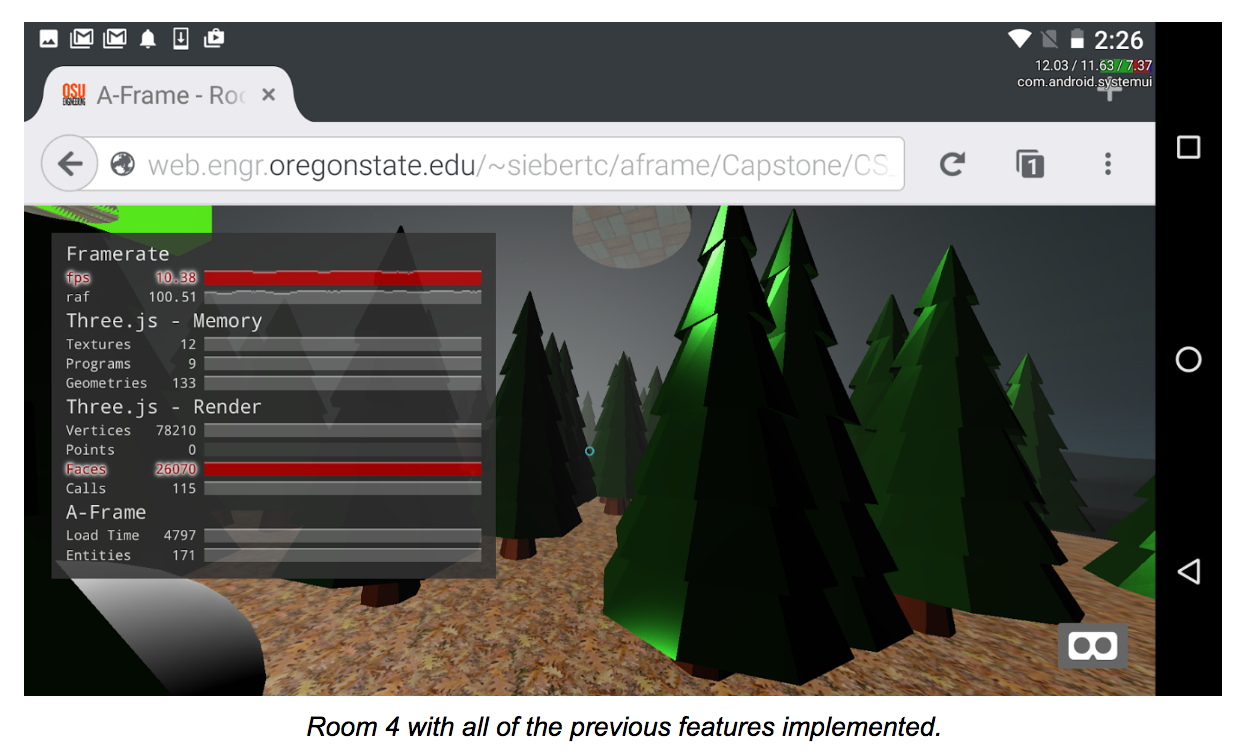
Room 4: All previous features implemented together.
Developers are unlikely to use just one of these specific features when creating their applications. We created this room to determine if the performance would drop at an exponential rate if all features were added together, as this would be a realistic scenario.
Further Information
You can find all the source code and documentation for our OVRAR project on Github.
If you have any questions, ask in the comments below. Thanks!
About Charles Siebert
More articles by Charles Siebert…
About Branden Berlin
More articles by Branden Berlin…