The Network Monitor tool has been available in Firefox since the earliest days of Firefox Dev Tools. It’s an invaluable tool for anyone who cares about page load performance and fast modern web pages. This tool went through extensive refactoring recently (under the project codename Netmonitor.html), and this post is intended as an explanation of how we designed the new architecture and what cool new technologies we used.
See the Network Monitor running inside the Firefox Developer Toolbox:
Goals
One of the main goals of the refactoring was to rebuild the entire tool on top of standard web technologies. We removed all Firefox-specific legacy code like XUL (XML User Interface Language) but also the code that used Firefox-specific APIs. This is a great step forward since using web standards now allows you to run the entire tool’s code base in two different environments:
- The Developer Toolbox
- Any web page
The first case is well known to anyone who’s familiar with Firefox Developer Tools (see also the screenshot above). The Developer Toolbox can easily be opened at the bottom of a browser window with various tools, Network Monitor included, at your fingertips.
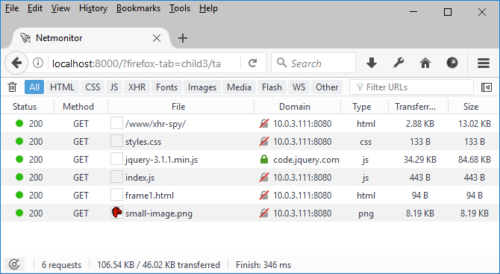
The second use case is new. Now the tool can be loaded within a browser tab just like any other standard web application. See how it looks like in the next screenshot:
Note that the page is loaded from localhost:8000. This is where the development server is running.
The ability to run the tool as a web app is a big deal! Now we can use all in-browser tools for the development workflow. Although it was possible to use DevTools to debug DevTools before (with the Browser Toolbox), it is now so much easier and more convenient to simply use the in-browser tools. And of course, we can also load the tool in other browsers. The development is also simpler since we don’t have to build Firefox. Instead, a simple tab-refresh is enough to get Network Monitor reloaded and test your code changes.
Architecture
We’ve build the new Network Monitor front-end on top of the following technologies:
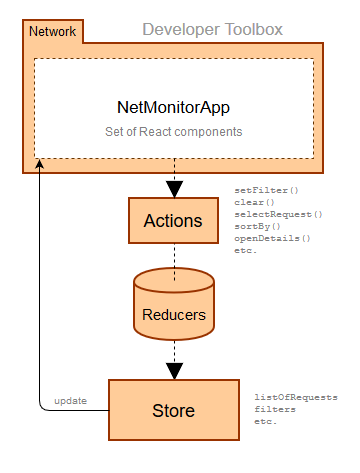
Firefox Developer Tools need complex UI features and we are using the popular React & Redux combo for all of our tools to build a clean and consistent code base. The Network Monitor is no exception. We’ve implemented a set of React components that are responsible for rendering the view (UI), a store with all data collected by HTTP interception and finally a set of actions the user might want to execute.
We’ve also changed the way we write tests. Instead of using the Firefox specific test harness we are slowly shifting towards well known libraries like Mocha and Enzyme. This way it is easier to understand our code base and also contribute to it.
We are using Webpack to build a bundle when running inside a web page. The bundle is consequently served through localhost:8000.
The general architecture is based on a flow introduced in the React & Redux concept.
- The root component representing the NetMonitorApp can be rendered within Developer Toolbox or a web page.
- Actions are responsible for things like filtering, clearing the list of requests, sorting and opening a side panel with detailed information.
- All of our data are stored within a store object. Including all the collected data about HTTP traffic.
New Features
We’ve been focused mostly on codebase refactoring, but there were some new features/UI improvements implemented along the way as well. Let’s see some of them.
Column Picker
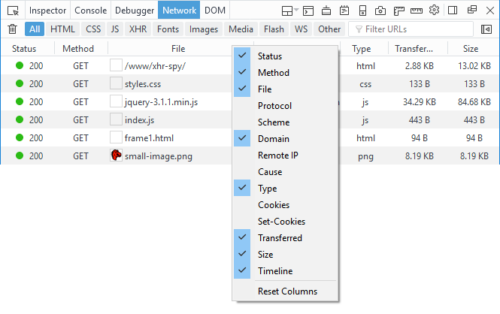
There are new columns with additional information about individual requests and the user can use the context menu to select those that are important.
Summary Data
We’ve implemented a better summary for currently displayed requests in the list. It’s now located at the bottom of the panel.
![]()
- Number of requests in the list
- Size/transferred size of all requests
- Total time needed to load all requests
- Time when
DomContentLoadedevent occurred - Time when load event occurred
Filtering By Properties
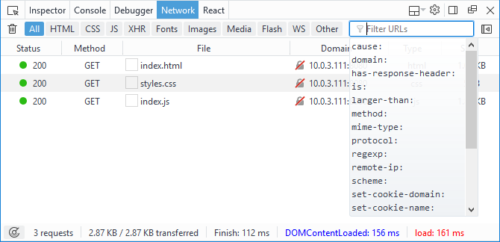
The existing Filter UI is now a lot more powerful. It’s possible to filter the list of requests according to various properties. For example, you can type: larger-than:50 into the Filter input box to see only those requests that are larger than 50 bytes.
Read more about filtering by properties on MDN.
Learn More in MDN
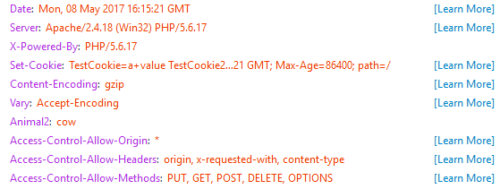
There are links in many places in the UI pointing to MDN for more information. For example, you can quickly learn how various HTTP headers are used.
Conclusion
We believe that building the new generation of Firefox Developer Tools on top of web standards is the right way to go since it means the tools can run in different environments and integrate more effectively with other projects (e.g., IDEs). Building on web standards makes many things possible: Now we can also think about shipping our tools as an online web service that can benefit from the internet platform. We can share collected data as well as debugging context across the web, opening doors to a real social debugging world.
The Netmonitor.html team has done a tremendous amount of work on the refactoring. Big thanks to the core team:
- Ricky Chien
- Fred Lin
But there has been many external contributors as well:
- Jaroslav Snajdr
- Leonardo Couto
- Tim Nguyen
- Deepjyoti Mondal
- Locke Chen
- Michael Brennan
- Ruturaj Vartak
- Vangelis Katsikaros
- Adrien Enault
- And many more…
Let us know what you think. You can join us on the devtools-html Slack.
Jan ‘Honza’ Odvarko
Read next: Hacking on the Network Monitor
About Jan Honza Odvarko
Honza is working on Firefox Developer Tools


10 comments