
When we announced Project Quantum last October, we talked about how users would benefit from our focus on “performance gains…that will be so noticeable that your entire web experience will feel different.”
We shipped the first significant part of this in Firefox 53, and continue to work on the engineering side. Now let’s dive into the performance side and the work we’re doing to ensure that our users will enjoy a faster Web experience.
What makes work on performance so challenging and why is it so important to include the user from the very beginning?
Performance — a contested subject, to say the least!
Awareness of performance as a UX issue often begins with a negative experience – when things get slow or don’t work as expected. In fact, good performance is already a table stake, something that everyone expects from an online product or service. Outstanding performance will very soon become the new baseline point of reference.
The other issue is that there are different perspectives on performance. For users, performance is about their experience and is very often unspecific. For them, perception of good performance can range from “this is amazingly fast” to “SLOW!”, from “WOW!” to “NO!”. For engineers, performance is about numbers and processes. The probes that collect data in the code often measure one specific task in the pipeline. Measuring and tracking capabilities like Garbage Collection (GC) enables engineers to react to regressions in the data quickly, and work on fixing the root causes.
This is why there can be a disconnect between user experience and engineering efforts at mitigation. We measure garbage collection, but it’s often measured without context, such as whether it runs during page load, while the user interacts with a website, or during event queue idle time. Often, GC is within budget, which means that users will hardly perceive it. More generally, specific aspects of what we measure with our probes can be hard to map to the unspecific experience of performance that users have.
Defining technical and perceived performance
To describe an approach for optimizing performance for users, let us start by defining what performance means. For us, there are two sides to performance: technical performance and perceived performance.
Under technical performance, we include the things that we can measure in the browser: how long page elements take to render, how fast we can parse JavaScript or — and that is often more important to understand — how slow certain things are. Technical performance can be measured and the resulting data can be used to investigate performance issues. Technical performance represents the engineer’s viewpoint.
On the other hand, there is the topic of how users experience performance. When users talk about their browser’s performance, they talk about perceived performance or “Quality of Experience” (QoE). Users express QoE in terms of any perceivable, recognized, and nameable characteristic of the product. In the QoE theory, these are called QoE features. We may assume that these characteristics are related to factors in the product that impact technical performance, the QoE factors, but this is not necessarily given.
A promising approach to user-perceived optimization of performance is to identify those factors that have the biggest impact on QoE features and focus on optimizing their technical performance.
Understanding perception
The first step towards optimizing Quantum for perceived performance is to understand how human perception works. We won’t go into details here, but it’s important to know that there are perception thresholds of duration that we can leverage. The most prominent ones for Web interactions were defined by Jacob Nielsen back in the 1990s, and even today, they are informing user-centric performance models like RAIL. Following Nielsen’s thresholds gives a first good estimate about the budget available for certain tasks to be performed by the browser engine.
With our user research team, we are validating and investigating these perceptual thresholds for modern web content. We are running experiments with users, both in the lab and remotely. Of course, this will only happen with users’ consent and everybody will be able to opt in and opt out of these studies at any time. With tools like Shield, we run a set of experiments that allow us to learn about performance and how to improve it for users.
However, knowing the perceptual thresholds and the respective budget is just an important first step. Following, we will go a bit more into detail about how we use a data-informed approach for benchmarking and optimizing performance during the development of our new browser engine.
Three pillars of perceived Web performance
The challenge with optimizing perceived performance of a browser engine is that there are many components involved in bringing data from the network to our screens. All these components may have an impact on the perceived performance and on the underlying perceptual thresholds. However, users don’t know about this structure and the engine. From their point of view, we can define three main pillars for how users perceive performance on the Web: page load, smoothness and responsiveness.
- Page load: This is what people notice each time when loading a new page. Users care about fast page loads, and we have seen in user research that this is often the way users determine good or bad performance in their browser. Key events defining the perceptual budget during page load are: an immediate response to the user request for a new page, also known as “First Render” or “First non-blank Paint“, and the moment when all important elements are displayed, currently discussed as Hero Element Timing.
- Smoothness: Scrolling and panning have become challenging activities on modern websites, with infinite scrolling, parallax effects, and dynamic sticky elements. Animations create a better user experience when interacting with the page. Our users want to enjoy a smooth experience for scrolling the web and web animations, be it on social media pages or when shopping for the latest gadget. Often, people nowadays also refer to smoothness as “always 60 fps”.
- Responsiveness: Beyond scrolling and panning, the other big group of user interactions on websites are mouse, touch, and keyboard inputs. As modern web services create a native-like experience, user expectations for web services are more demanding, based on what they have come to expect for native apps on their laptops and desktop computers. Users have become sensitive to input latency, so we are currently looking at an ideal maximum delay of 100ms.
Targeted optimization for the whole Web
But how do we optimize these three pillars for the whole of the Web? It’s a bigger job than optimizing the performance of a single web service. In building Firefox, we face the challenge of optimizing our browser engine without knowing which pages our users visit or what they do on the Web, due to our commitment to user privacy. This also limits us in collecting data for specific websites or specific user tasks. However, we want to create the best Quality of Experience for as many users and sites as possible.
To start, we decided to focus on the types of content that are currently most popular with Web users. These categories are:
- Search (e.g.Yahoo Search, Google, Bing)
- Productivity (e.g. Yahoo Mail, Gmail, Outlook, GSuite)
- Social (e.g. Facebook, LinkedIn, Twitter, Reddit)
- Media (e.g. YouTube, Netflix, SoundCloud, Amazon Video)
- E-commerce (e.g. eBay or Amazon)
- News & Reference (e.g. NYTimes, BBC, Wikipedia)
Our goal is to learn from this initial set of categories and the most used sites within them and extend our work on improvements to other categories over time. But how do we now match technical to perceived performance and fix technical performance issues to improve the perceived ones?
A data-informed approach to optimizing a browser engine
The goal of our approach here is to take what matters to users and apply that knowledge to achieve technical impact in the engine. With the basics defined above, our iterative approach for optimizing the engine is as follows:
- Identification: Based on the set of categories in focus, we specify scenarios for page load, smoothness, and responsiveness that exceed the performance budget and negatively impact perceived performance.
- Benchmarks: We define test cases for the identified scenarios so that they become reproducible and quantifiable in our benchmarking testbeds.
- Performance profiles: We record and analyze performance profiles to create a detailed view into what’s happening in the browser engine and guide engineers to identify and fix technical root causes.
Identification of scenarios exceeding performance budget
Input for identifying those scenarios come through different sources. They are either informed by results from user research or can be reported through bugs or user feedback. Here are two examples of such a scenario:
- Scenario: browser startup
- Category: a special case for page load
- Performance budget: 1000ms for First Paint and 1500ms for Hero Element
- Description: Open the browser by clicking the icon > wait for the browser to be fully loaded as maximized window
- What to measure: First Paint: browser window appears on Desktop, Hero Element: “Search” placeholder in the search box of the content window
- Scenario: Open chat window on Facebook
- Category: Responsiveness
- Performance budget: 150ms
- Description: Log in to Facebook > Wait for the homepage to be fully loaded > click on a name in the chat panel to open chat window
- What to measure: time from mouse-click input event to showing the chat window on screen
Benchmarks
We have built different testbeds that allow us to obtain valid and reproducible results, in order to create a baseline for each of the scenarios, and also to be able to track improvements over time. Talos is a python-driven performance testing framework that, among many other tests, has a defined set of tests for browser startup and page load. It’s been recently updated to match the new requirements and measure events closer to user perception like First Paint.
Hasal, on the other hand, focuses on benchmarks around responsiveness and smoothness. It runs a defined set of scripts that perform the defined scenarios (like the “open chat window” scenario above) and extracts the required timing data through analyzing videos captured during the interaction.
Additionally, there is still a lot of non-automated, manual testing involved, especially for first rounds of baselining new scenarios before scripting them for automated testing. Therefore, we use a HDMI capture card and analyze the recorded videos frame-by-frame manually.
All these testbeds give us data about how critical the identified scenarios are in terms of exceeding their respective perceptual budgets. Running benchmarks regularly (once a week or even more often) for critical scenarios like browser startup also tracks improvements over time and provides good direction when improvements have moved the scenario into the perceptual budget.
Performance profiles
Now that we have defined our scenarios and understand how much improvement is required to create good Quality of Experience, the last step is to enable engineers to achieve these improvements. The way that engineers look at performance problems in the browser engine is through performance profiles. Performance profiles are a snapshot of what happens in the browser engine during a specific user task such as one of our defined scenarios.
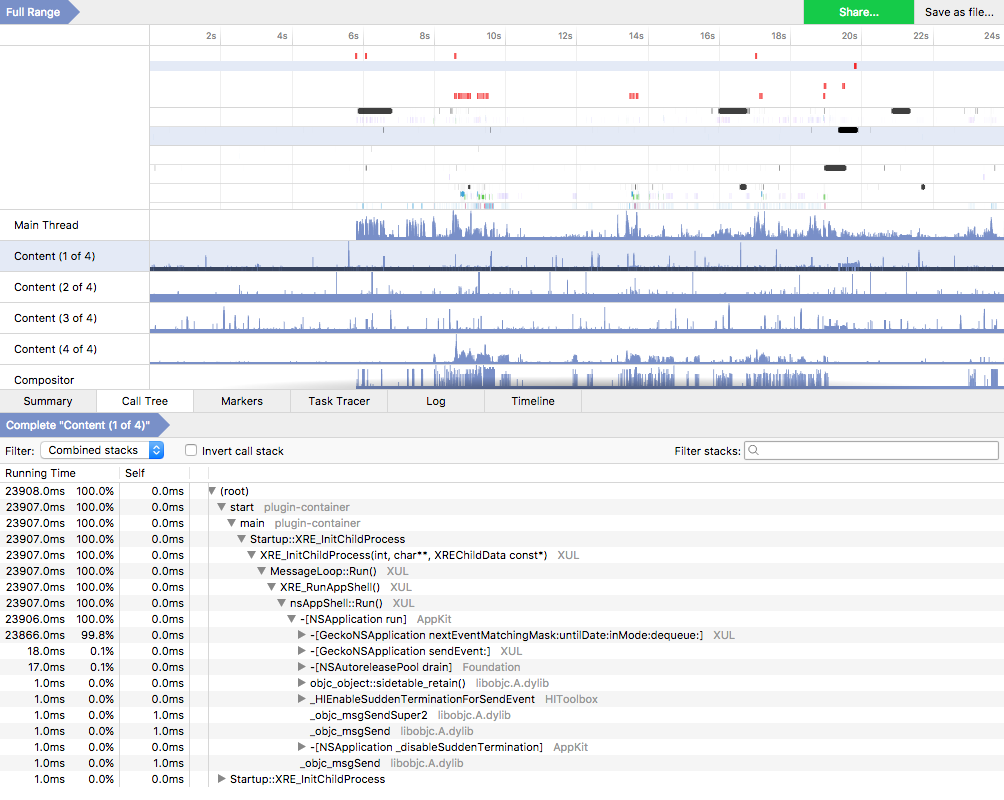
A performance profile using the Gecko Profiler. The profile shows Gecko’s main thread, four content threads, and the compositor main thread. Below is the call stack.
A profile consists of a timeline with tracing markers, different thread timelines and the call tree. The timeline consists of several rows that indicate interesting events in terms of tracing markers (colored segments). With the timeline, you can also zoom in to get more details for marked areas. The thread timelines show a list of profiled threads, like Gecko’s Main Thread, four content process threads (thanks to multi-process), and the main thread of the compositor process, as seen in the profile above. The x-axis is synced to the timeline above, and the y-axis shows the stack depth at a given point in time. Finally, the call tree shows the collected samples within a given timeframe organized by ‘Running Time’.
It requires some experience to be able to read these performance profiles and translate them into actions. However, because they map critical user scenarios directly to technical performance, performance profiles serve as a good tool to improve the browser engine according to what users care about. The challenge here is to identify root causes to improve performance broadly, rather than focus on specific sites and individual bugs. This is also the reason why we focus on categories of pages and not an individual set of initial websites.
For in-depth information about performance profiles, here is an article and a talk from Ehsan Akhgari about performance profiles. We are continuously working on improving the profiler addon which is now written in React/Redux.
Iterative testing and profiling performance
The initial round of baselining and profiling performance for the scenarios above can help us go from identifying user performance issues to fixing those issues in the browser engine. However, only iterative testing and profiling of performance can ensure that patches that land in the code will also lead to the expected benefits in terms of performance budget.
Additionally, iterative benchmarking will also help identify the impact that a patch has on other critical scenarios. Looking across different performance profiles and capturing comparable interactions or page load scenarios actually leads to fixing root causes. By fixing root causes rather than focusing on one-off cases, we anticipate that we will be able to improve QoE and benefit entire categories of websites and activities.
Continuous performance monitoring with Telemetry
Ultimately, we want to go beyond a specific set of web categories and look at the Web as a whole. We also want to go beyond manual testing, as this is expensive and time-consuming. And we want to apply knowledge that we have obtained from our initial data-driven approach and extend it to monitoring performance across our user base through Telemetry.
We recently added probes to our Telemetry system that will help us to track events that matter to the user, in the wild across all websites, like first non-blank paint during page load. Over time, we will extend the set of probes meaningfully. A good first attempt to define and include probes that are closer to what users perceive has been taken by the Google Chrome team and their Progressive Web Metrics.
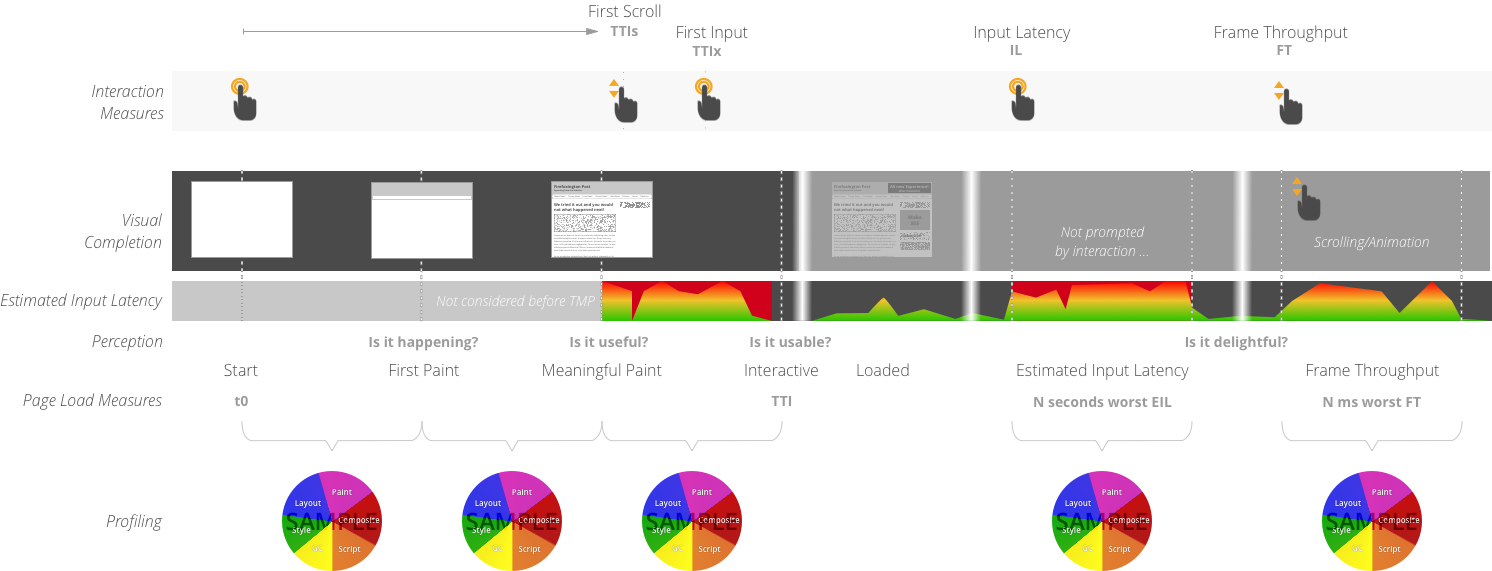
A visualization of Progressive Web Metrics during page load and page interaction. The upper field shows the user interaction level and critical interactions related to the technical measures.
As mentioned in the beginning, for users performance is a table stake, something that they expect. In this article, we have explored: how we capture issues in perceived performance, how we use benchmarks to measure the criticality of performance issues, and how to fix the issue by looking at performance profiles.
Beyond the scope of the current approach to performance, there’s an even more interesting question: Will improved performance lead to more usage of the browser or changes to how users use their browser? Can performance improvements increase user engagement?
But these are topics that still need more research — and, at some point in time, will be the subject for another blog post.
Meanwhile, if you are now interested to follow along on performance improvements and experience the enhanced performance of the Firefox browser, go download and install the latest Firefox Nightly build and see what you think of its QoE.
About Dominik Strohmeier
Dominik works on perceived performance and Quality of Experience on Mozilla's Strategy and Insights team. He loves to improve products for users by better understanding how users use experience the browser and the Web.
More articles by Dominik Strohmeier…
About Harald Kirschner (digitarald)
Harald "digitarald" Kirschner is a Product Manager for Firefox's Developer Experience and Tools – striving to empower creators to code, design & maintain a web that is open and accessible to all. During his 8 years at Mozilla, he has grown his skill set amidst performance, web APIs, mobile, installable web apps, data visualization, and developer outreach projects.
3 comments