
Debugger.html is an open source project, built on top of React and Redux, that functions as a standalone debugger for Firefox, Chrome and Node. The debugger is also being integrated into the Firefox Developer Tools offering. Currently it is available in the Firefox 53 release behind the devtools.debugger.new-debugger-frontend preference.
The debugger.html project was announced last September and continues to improve with added features and functionality. In this post, we will cover some changes for the call stack display that are currently under development or recently implemented.
Call Stack Display
Most JavaScript debuggers offer a visual representation of the call stack. This display represents the execution context stack or simply the call stack, displaying a frame for each nested call currently being executed. Generically speaking, an execution context refers to the environment in which a function runs, including scoped variables, function arguments, etc. If your application provides a button to execute function A, then a new execution context is created and loaded onto the call stack when the button is clicked. Function A may call function B.
In this case, an execution context is created for function B and loaded onto the top of the call stack. If function B has a breakpoint set, the call stack display will show a frame for the button function, one for Function A and one for Function B. Essentially, the Call Stack display shows a chain of functions that are waiting to be completed and return a value.

Selecting a frame in the Call Stack display will update the Scopes display with the variables for that particular frame. Clicking on the filename in the display will open that specific file in the editor. The Call Stack display is a great tool for tracking execution flow through your application. That said, with complex libraries or frameworks the display can become convoluted and difficult to follow.
The Debugger.html team is working on several key features that will improve the usability of the Call Stack display and make it more intuitive to understand. We’ll take a closer look at these four:
- Simplifying function names
- Highlighting libraries
- Collapsing library frames
- Naming library frames
Simplifying Function Names
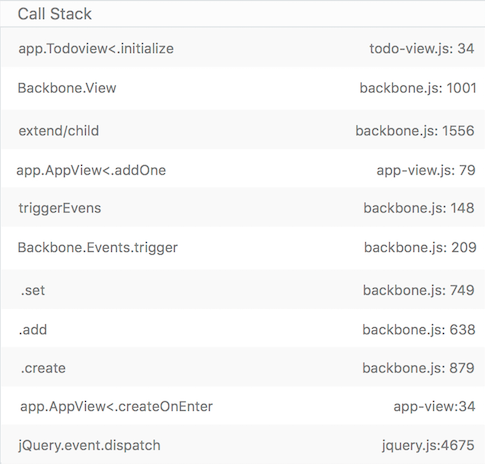
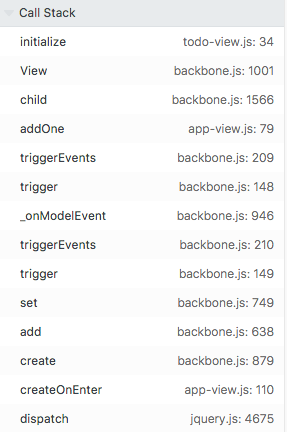
The vast majority of JavaScript functions are not named, making them anonymous. This presents a problem: the call stack currently gives verbose function names to anonymous functions. In practice, an anonymous function might be given the name app.AppView<.success because it is defined in the AppView class. It’s important to be able to scan the call stack quickly. In this context, it’s helpful to see the simplest name possible (success). Compare the image below to the previous image of the call stack. This feature is currently implemented in the latest source code for the debugger.html project.
Highlighting Libraries
Libraries and frameworks are used in a large portion of web applications. In the process of debugging your code, sending calls to the library or framework can quickly fill up the Call Stack display. In most cases, it’s helpful to quickly identify and exclude libraries from your debugging work, since most bugs will likely be found in your custom application code. The debugger now includes a library highlight feature, which replaces the file URL and line location with the library name and logo, so that you can focus your debugging efforts more efficiently on your own code.
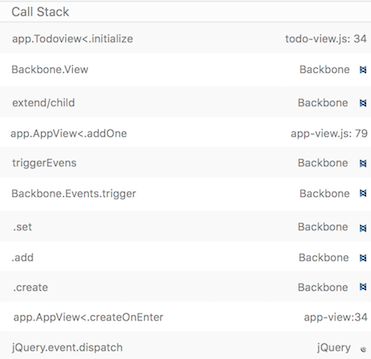
Note that this setting can be reverted in the debugger settings page, if you need to debug a library.
Collapsing Library Frames
In similar fashion, you can unclutter your view of the debugging effort by collapsing multiple function calls within a library into one visual line in the Call Stack display. This will further reduce the visual noise and help you locate and debug your application code. With this feature turned on, the previous stack trace now looks like this:

Then you can view the nested frames by clicking the frame to open it.
With these three features enabled, you gain access to a very simple view that can improve your debugging workflow. As with the previous feature, collapsing can be disabled.
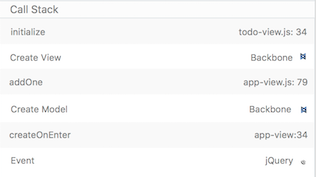
Naming Library Frames
Collapsing the library frames offers an additional benefit. It gives you a way to describe what the library is doing in the combined lines that are collapsed. For example, instead of showing two frames for jQuery elemData.handle, and event.dispatch functions, we can simply show the label event. This can also encourage better naming conventions for describing specific library or framework operations such as rendering, routing, or doing any other task. For example, in Call Stack display image above, the display will show when the Backbone Model and Views are created.
This feature is currently under development in order to provide better names for the library operations taking place in the collapsed library frames. Naming should be specific to individual libraries and should summarize all the operations taking place in the lines of code represented by the one collapsed display item.
Conclusion
We’re really excited about how the new call stack will help users debug and improve their web applications. This is just the beginning, we hope to introduce more framework improvements in the coming months.
The Debugger.html team welcomes new contributors and suggestions for improving the tool. If you are interested in helping to build or have suggestions for an improved product, check out the README on our GitHub page.
About jlaster
Staff Engineer on Firefox Developer Tools devving the DevTools and debugging the debugger.
6 comments