
We didn’t have a chance to blog when Firefox Developer Edition 53 came out, so now that 54 is out too, let’s discover what new features and bugs fixes made it into these new releases.
There is a lot to cover so we will get right to it.
Inspector
The inspector now fully supports CSS color level 4, which means that new color syntax like hsl(120deg 100% 50%) is recognized in the CSS Rules panel.
People love our screenshot feature. In Developer Edition 53 we added a setting that, when turned on, will copy screenshots to your clipboard directly, so you can paste those images directly in other applications.
Firebug users used to be able to copy the full CSS path of any node in the inspector. This feature has now also been added to Firefox DevTools, as demonstrated here:
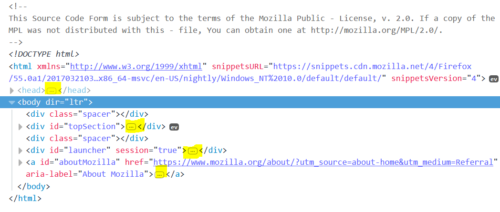
When nodes are collapsed in the inspector, it’s not possible to know whether they have children or not. A visual hint is displayed between the opening and closing tags as shown below:
A lot of work was done to make the inspector faster and more reliable. In particular, the DOM tree now initializes with the DOMContentLoaded event.
The CSS Grid inspector, that can be toggled from the CSS rules panel, is now displayed for cases like display:inline-grid or display:grid !important.
Asynchronous Panning and Zooming (APZ for short) is the technology in Firefox that makes scrolling long pages super fast and smooth. Now, all the overlays that the inspector displays on web pages (like the box-model or the CSS grid lines) also benefit from it and scroll smoothly with the page.
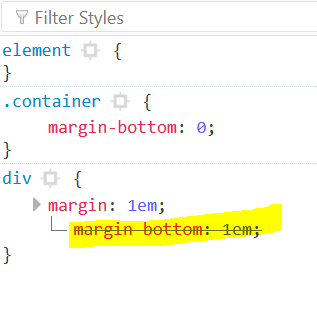
In some situations, it may be hard to know that part of a property is overridden in a CSS rule. For instance, when only a longhand part of a shorthand property (e.g. margin-bottom in margin) gets overridden, the CSS rules panel didn’t show this unless you expand the shorthand property. This has changed, and the CSS rules panel now looks like this:
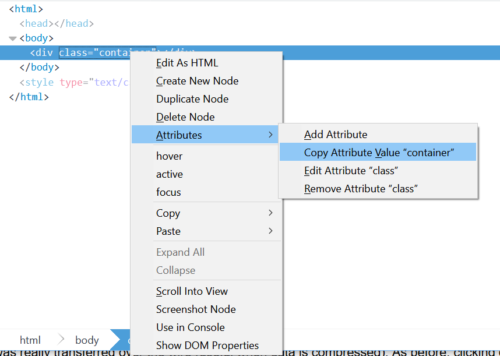
Right-clicking on an attribute in the inspector now gives you a menu item that lets you copy attribute values. (This is in addition to editing, adding, and deleting, which were already available.):
Debugger
Our awesome new debugger front-end (available to our Nightly and Developer Edition users for now) gained a ton of new features in Firefox 54.
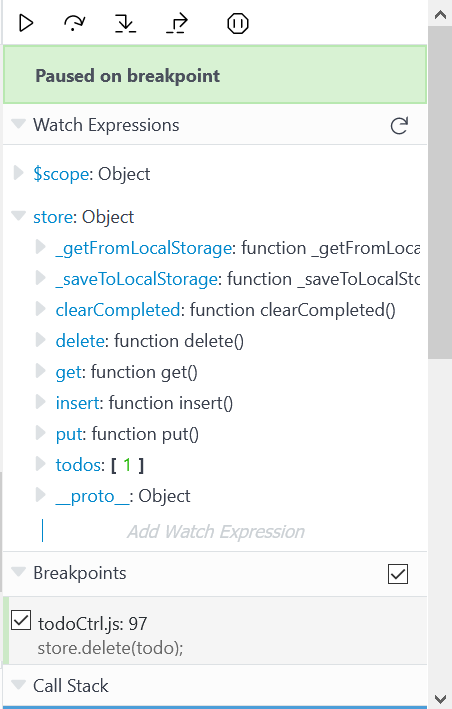
You can now add watch expressions in the right sidebar, which will be evaluated when you pause:
A lot of the UI state is saved between sessions now: Opened tabs, whether the sidebar is collapsed, the selected source, whether you want to pause on exceptions, etc., making it easier and much more intuitive to start debugging again.
The debugger now also supports collapsing the layout to a vertical mode when there isn’t enough space:
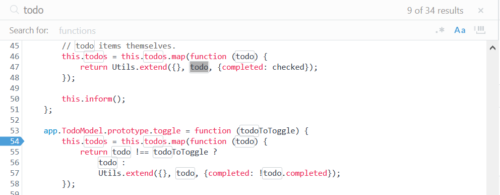
Code search is also much improved: Outlines are shown around matches, the total number of results is also displayed in the search bar, and a brand new function search option is now available:
The pretty-printing feature has been implemented, so you can now make those minified files much easier to read. Pretty-printing a source file opens the pretty version in another tab:
Finally, hovering over a variable in the source now pops-up a preview tooltip for this variable, and lets you see its value:
Storage
First a reminder: If you don’t see the Storage panel in DevTools, you’ll need to enable it first in the settings panel. (We will soon be working on a new way to open new tools.)
In the cookies section, multiple cookies with the same name are now shown correctly.
Local data stored by Web Extensions are now also displayed in the storage panel.
The IndexedDB storage type can now be seen in a new column. You can learn more about storage types on MDN.
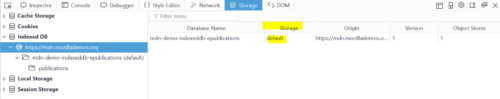
Last, but definitely not least, the storage panel is now a lot faster when your Firefox browser profile has a lot of IndexedDB data in it.
Network Monitor
You might know that we spent a lot of last year migrating our tools away from XUL markup and Firefox-only JavaScript to standard HTML, CSS and JavaScript. (I blogged about this in January). Well, I’m really pleased to report that the Network Monitor is now part of that revamped tool set. It should be much easier to work on the panel if you have some HTML, CSS, and React experience.
We have also added some MDN documentation goodness in the Network Monitor. In particular, both HTTP status codes and HTTP response headers get [Learn More] links that will open relevant documentation pages on MDN:
There is now a new “transferred” size in the monitor’s toolbar that indicates how much data was really transferred over the wire (useful when data is compressed). As before, clicking on this label brings up the performance summary view, but now this view also includes the transferred size:
![]()
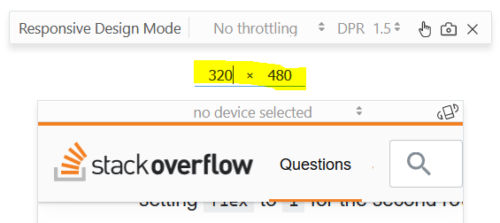
Responsive Design Mode
The dimension controls have been moved above the viewport so they’re easier to see and use:
We also added the ability for users to enter their own custom devices to the list of pre-defined devices:
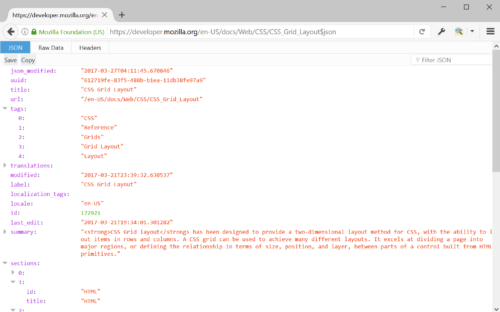
JSON Viewer
The JSON Viewer has been around on our Nightly and Developer Edition channels for a while.
With Firefox 53, we enabled it on all channels. This means that if you run the standard release of Firefox, very soon JSON responses in tabs will be much easier to read and explore:
The JSON Viewer is now displayed for files with the application/manifest+json mime-type.
New Web Extensions API for DevTools
WebExtensions are Firefox’s new way to write extensions for the browser that are compatible to a large extent with Google Chrome and Opera.
Firefox now supports new DevTools-related WebExtensions APIs, which means that Chrome DevTools extensions are going to start working with Firefox too!
In particular, it is now possible to create new DevTools panels with the devtools.panels.create API, or even execute code in the content window with the devtools.inspectedWindow.eval API.
We created a GitHub repository that provides examples of how to build WebExtensions using the DevTools API.
Right-to-Left Layout Improvements
Many RTL (right-to-left) improvements were made in these last couple of releases.
The settings panel now fully supports RTL, the computed styles panel in the inspector also works better with RTL, the JSONViewer now supports it, the DOM panel also received some RTL love, and finally RTL support also came to the font panel in the inspector.
More Bug Fixes
The Firebug theme received a variety of fixes and now works much better for our Mac and Linux users (in particular font-size, some padding, breadcrumbs, and various colors were fixed).
The icon for the new Responsive Design Mode in the toolbar was changed. It was confusingly similar to the docking icon, and is now easier to find:
Finally, all the buttons shown in the toolbar now display the corresponding keyboard shortcuts on hover!
Thank You!
Many volunteer contributors have helped fix bugs and implement new features in these releases, so warm thank yous to all (in no particular order)!:
- Kimberly Pennington
- Yann Gravrand
- Tomer Cohen
- Micah Tigley
- Jaideep Bhoosreddy
- Tooru Fujisawa
- Thomas Dräbing
- Adrien Enault
- Iulian Radu
- Ruturaj Vartak
- Rahul Chaudhary
- Oliver Scheiwiller
- Tim Nguyen
- Bao Quan
- Nick Fox
- Eduardo Bouças
- Leonardo Couto
- Kerem Kat
- Ken Lee
- Cosm
- Jarda Snajdr
- Florian Apolloner
- Fabien Casters
- Deepjyoti Mondal
- Dalimil Hajek
- Nicolas Chevobbe
- Taylor Alexander Brown
- Michael Brennan
- André Bargull
- Sébastien Blin
- Ajay Krishna
- Ahmed Towkir
You can see the full list of bugs if you’re interested.
As always, let us know what you think about this. You can add a comment right here, file a bug if you notice something wrong, or discuss new ideas or ask for help on our Discourse forum.
About Patrick Brosset
Patrick manages the DevTools engineering team at Mozilla
14 comments