DevTools: What you need to know

The end of the year is always very busy, so we wanted to take one final look back at the last months of 2016.

Many things changed in Firefox DevTools last year, particularly towards the end of the year. The effort to refactor some of our tools started to pay off and we landed some great re-designs that should make web developers’ lives easier.

Shiny new tools

We shipped a brand new CSS Grid inspection tool, first of its kind (thank you gabrielluong, helenvholmes, and jensimmons).

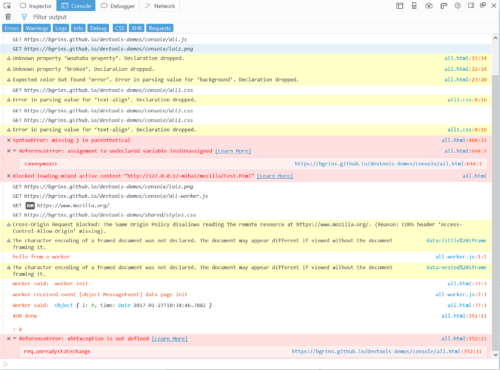
We also shipped a brand new, redesigned, console panel. It’s only enabled in Nightly for now, but it’s on track to be enabled everywhere very soon.

A lot of work went into creating Reps, the reusable widgets responsible for displaying all kinds of output in the console. This is great because these reps are shareable components that we’ve already begun to use in many other DevTools.

Thank you to a lot of people, especially contributor nicolaschevobbe, bgrins, Honza, linclark, and others.

Screenshot of the new front-end for the web console panel in firefox

2016 was also the year we shipped our brand new debugger front-end! This was an accomplishment that we can be proud of, that sets the stage for more awesome tool releases in 2017.

I’m personally really excited by the impact we’ve seen since moving this project to GitHub. The beginning of 2017 will be an interesting time for us to experiment with moving even more code to GitHub. I’m already confident that this is the right thing for us to do at this stage, and we have the debugger project to thank for this.

Props go to jasonlaster, jlongster, clarkbw and the debugger github community that has been so great.

Animation showing the new debugger front-end in action in Firefox.

As if that’s not enough to impress, we also shipped the new, completely redesigned RDM (responsive design mode) in November 2016.

Not only do the responsive views look and work better, RDM also comes with major new features like network throttling and more. Thank you to jryans, zer0, gabrielluong.

There is no XUL. Only Web.

2016 was the year when the team actively removed non-standard XUL markup and Firefox-only privileged JavaScript from the tools. In fact, we were able to load the inspector panel in a normal browser tab by end of year, which means that the inspector is now built entirely with HTML and web APIs.

Great work bgrins, juliandescottes, tromey.

The team even went as far as putting in place an npm-based local development workflow so you can build the inspector, open it in a browser tab, make changes and see them in the browser by simply reloading the page!

Moving on to the network panel, thanks to the hard work of Honza, rickychien, steveck, gasolin and contributor jsnajdr, the panel has been almost entirely cleaned of its XUL markup and migrated to React! We now have a new and  more modern code base that I’m sure will be very exciting for people to work with.

Speaking of the end of XUL, tatumcreative eradicated a large piece of old code by re-writing the toolbox tabs using HTML and React.

Inspector gets a refresh

A lot of work went into fixing “paper-cut” bugs – you know, those little (or not so little) annoyances that make it frustrating to use our UI.

A big thank you to ochameau for making the inspector a lot faster and more resilient and to mikeratcliffe for fixing many bugs of the inspector event tooltip.

While I’m covering the inspector, let me mention some other noteworthy new features: css level 4 colors are now supported (thanks jerry and tromey), there are visual hints between closing and opening tags (thanks juliandescottes), text nodes are highlighted (juliandescottes again), and whitespaces in inline layouts are easy to debug (thanks to me 😀).

Random but lovely

Our tools have became a little bit better for RTL (right-to-left) users too, thanks to contributor tomer.

Service worker’s statuses are now visible in about:debugging thanks to juliandescottes.

The animation tooling can display easings thanks to daisuke and birtles.

We’ve also written more React than ever before. I’m very happy that our UI is converging towards one common style. Thank you jlongster for showing us the way!

mikeratcliffe did a ton of work on the storage inspector too, so it works even better with IndexedDB, is able to delete cookies, and more.

Looking ahead

In 2016 we also spent time planning for the future and in particular setting up for the new Performance Tool project.

A lot of talking and design work happened. We are now confident that we’ll be able ship an awesome performance tool that Firefox and web developers will love to use.

Thank you jimb, tatumcreative, ejpbruel, mstange.

Thanks to all who contributed to making DevTools better in 2016. Thank you to all the contributors who helped fix DevTools bugs. I could not mention them all here unfortunately.

Let’s have a great 2017 together!

Cheers,
Patrick

About Patrick Brosset

Patrick manages the DevTools engineering team at Mozilla

More articles by Patrick Brosset…


25 comments

  1. jxn

    These are really great advancements! I still get complaints from my developers about the console not opening or opening empty sometimes with no visible nodes. The other sore spot seems to be no live editing of JS loaded in the page.

    Will the new debugger make it easier to do replay debugging?

    My personal most-wanted feature list is very small:
    * right-click “copy attribute value” in the inspector
    * more filter (e.g. status_code > 200, method != GET, content-type, custom headers) and column (full path!) options in network panel
    * improved Service Worker debugging (force reload, UI improvements)

    Can these types of changes now be introduced solely using the github project, without building Firefox from HG source?

    Thanks for the great work!

    January 31st, 2017 at 09:22

    1. Patrick Brosset

      Thank you jxn!

      * Empty console: that’s troubling. We’ve recently fixed a bunch of empty inspector bugs, but I have never heard of empty console problems. If you ever get a chance to reproduce this problem, we’d love to hear about it (could be on twitter @FirefoxDevTools, discourse https://discourse.mozilla-community.org/c/devtools, or bugzilla https://bugzilla.mozilla.org/enter_bug.cgi?product=Firefox&component=Developer%20Tools)

      * Live JS editing: yeah I know, that’s a big missing piece. It’d definitely known and has been discussed many times, but is proving really hard to implement with our current architecture unfortunately.

      * Replay debugging: not yet, but record/replay is definitely in the works, and we might even get something in 2017! Stay tuned.

      * Copy attribute value: hm, interesting feature. I found out that we do have a bug about this already: https://bugzilla.mozilla.org/show_bug.cgi?id=1231932
      It should be really easy to add, and we do have 2 submenus in our inspector context menu (copy and attributes) which we could use to add this new menu item. I will try to get this moving forward.

      * Network panel filters and Service Worker debugging: I can’t speak to these, but I’ll make sure the right people know about these.

      * Contributing to DevTools on GitHub: yes, completely doable for the debugger panel. None of the other panels are there yet though, but we are experimenting with this right now, and will have a plan for moving more of our tools to GitHub in a couple of months.
      Having said this, we do have a couple of ways to contribute to DevTools using the HG source, but without having to build Firefox:

      * artifact builds take under 5 minutes: https://developer.mozilla.org/en-US/docs/Artifact_builds
      * DevTools reload addon require no building at all: https://developer.mozilla.org/en-US/docs/Tools/Contributing/Contribute_on_nightly
      * More recently, we landed a npm-based dev workflow for the inspector panel, so even though you still need to download the HG source, you can simply `npm install`, `npm start` within the inspector folder, and you’re all set to work on the inspector just like on any web app (F5 to reload in a browser tab, no build needed). Although that’s very experimental still.

      February 1st, 2017 at 01:27

      1. jxn

        Thanks,
        * I did make a mistake, I meant empty inspector panel, *NOT* console.
        * Replay debugger, live editing, and speed seem to be what most devs I talk to really find lacking in DevTools.
        * thanks for pushing on copy attribute value! There are already tickets for improvements for Network filter (https://bugzilla.mozilla.org/show_bug.cgi?id=923192 and https://bugzilla.mozilla.org/show_bug.cgi?id=1041895 )
        * Service Worker has tickets for vague developer experience improvements (https://bugzilla.mozilla.org/show_bug.cgi?id=1209369), though IMHO it deserves own panel in the inspector, not relegation to about:debugging . Is it possible to move something as deep as SW into the devtools with inspector and console? or is this outside the scope of dev tools?

        February 1st, 2017 at 08:52

        1. Patrick Brosset

          Thanks jxn.
          About service works, moving some of the UI to devtools rather than inside about:debugging is definitely on the roadmap, although not planned in the coming quarters yet.

          February 2nd, 2017 at 00:21

      2. jxn

        By the way, thanks for the info on contributing to dev tools. I love the work y’all are doing to make it easier to contribute, and I really look forward to a day when (if ever, I hope!) dev tools are a standalone repo that I can just clone and hack on! It looks like it was already easier than I thought, though

        February 1st, 2017 at 08:54

  2. Noah

    I’d like a setting that allows me to have the color picker available without having to have the inspector panel open. (e.g. Such as using the color picker while being in the scratchpad or console.)

    January 31st, 2017 at 12:54

    1. Patrick Brosset

      This exists already, you can access the color picker from the Firefox hamburger menu, then submenu Developers, and then Eyedropper.
      This opens the tool on the current page and when you click, copies the color to your clipboard.
      I hope this helps!

      February 1st, 2017 at 01:06

    2. Luca

      Maybe something simlar to http://www.colorzilla.com/firefox/ ??

      February 1st, 2017 at 01:06

  3. Luca

    Hi,
    Thanks for continuous work on Developer Tools. Some time ago there was “ffdevtools.uservoice.com” to make suggestions for future developments but now… how can we ask for new features?

    Thanks

    February 1st, 2017 at 00:20

    1. Patrick Brosset

      Thanks! Unfortunately the uservoice channel had to be closed. It had ended up only receiving spam at some stage.
      We did open a new forum for DevTools users to ask questions and inquire about news features: https://discourse.mozilla-community.org/c/devtools

      February 1st, 2017 at 01:03

  4. Stephen

    Amazing work so far, congrats to everyone involved!

    Is there somewhere we can go to read the discussion RE: migrating from XUL to React? I’d be interested in knowing what the thought process and key points were. No criticism, just curiosity! :)

    Additionally, is there any plans to migrate from React to Web Components in the future now that the v1 spec has finally started to land?

    February 1st, 2017 at 04:00

    1. Patrick Brosset

      Thanks Stephen.

      In terms of dropping XUL and using React, here’s the announcement email from last year: https://groups.google.com/forum/#!searchin/mozilla.dev.developer-tools/xul$20react%7Csort:relevance/mozilla.dev.developer-tools/G7XvphTgtac/ED9Z97YjBgAJ

      Dropping XUL isn’t just a DevTools thing, it’s something Mozilla is going on a larger basis. The main point being that XUL is a non-standard technology that the rest of the web dev community is not using, and it forces us to maintain 2 rendering stacks in the same engine.

      As for adopting React, we don’t have a specific document that goes through the key points. It has been a slow experimentation process instead (and a fairly undocumented one unfortunately).

      February 1st, 2017 at 04:32

  5. Hervé

    Quickly (partially) translated to French here : https://mozillazine-fr.org/firefox-devtools-ce-que-vous-devez-savoir/

    February 1st, 2017 at 10:29

    1. Patrick Brosset

      Merci Hervé!

      February 2nd, 2017 at 00:18

  6. Vanco Ordanoski

    What developers need is Firebug capabilities, ASAP.
    Without Firebug and FirePHP, we lost the ability to debug the back-end.
    Computed box-model is not interactive, there is no way to refresh the browser from an editor, the console view is “polluted” with all kinds of logs, warnings, errors from all over the place …

    Please, do the basic stuff first!
    (very unsatisfied life-long user of Firefox as a primary development platform)

    February 2nd, 2017 at 09:21

    1. Patrick Brosset

      Thank you Vanco for your feedback.
      Fortunately, these are known things that we can and will work on.
      Let me comment to each of them:

      Firebug capabilities: we have been tracking them in this bug: https://bugzilla.mozilla.org/show_bug.cgi?id=991806 trying to address the most requested ones step by step. There’s of course more, but hopefully they should all be there in the bug and it’s just a matter of getting to them.
      Box-model not interactive: I am not sure what you mean by that. The box-model widget that you can find in the Computed tab does allow to change margin, border, padding, by clicking on the boxes. Maybe this is something else.
      All kinds of logs in the console: There are filters you can use to choose exactly which logs you want to see in the console, so that should be configurable easily: https://developer.mozilla.org/en-US/docs/Tools/Web_Console/Console_messages#Filtering_and_searching

      I’m sorry you are unsatisfied, and thank you for using Firefox as your primary development browser.

      February 6th, 2017 at 01:03

  7. newton

    parabéns por tanta tecnologia de ponta ,cada ano que passa conquistamos ,mais internautas ,aqui no Brasil ,crescemos cada dia mais ,tudo de bom muita saúde um bom ano pra nossa família Mozilla muito obrigado

    February 2nd, 2017 at 09:27

  8. jasser kandume

    awesome

    February 2nd, 2017 at 09:50

  9. Wellington Torrejais

    Nice! Good Job. Changes from xul to JS and the github project are welcome.

    February 2nd, 2017 at 15:00

  10. Carm Scaffidi

    Thanks for the very detailed update. I am very impressed to see the direction chosen was for main stream and standard usage.

    February 5th, 2017 at 07:39

  11. Alexandre Leduc

    As someone who still isses Firebug functionality, I really hope to see this enhacement make it into FF:

    If you already have a DOM properties panel implemented for the split console, why not:
    1: Mimic Firebug and move it next to the Rules, Computed, Animations and Fonts panels on the right of the Inspector.
    2. Mimic Firebug and auto update the DOM properties that are displayed when an element is selected in the Inspector. We shouldn’t have to click “Show DOM properties” each time we select a new element, just like we don’t have to click a “Show CSS rules” for CSS rules panel to display the currently selected element’s CSS rules.

    https://bugzilla.mozilla.org/show_bug.cgi?id=1320351

    February 6th, 2017 at 06:20

  12. Robert Kaiser

    Given how all the tools seem to become slower and lose functionality when transforming to HTML (was felt very deeply with debugger, but also others like inspector and web console), I get more appetite to check out if other browser have tools with more speed and features – even though I deeply and dearly love Mozilla and Firefox.

    That said, it there work going on for re-gaining performance and features (like ability to select which kind of JS/CSS messages you want in web console, or esp. the mouse-over variable inspector that was a killer feature in the old debugger)?

    February 8th, 2017 at 16:04

    1. Patrick Brosset

      Thanks for the feedback Robert.
      We definitely are working on improving performance of the tools. A bunch of work has been done in the inspector panel, and more is coming soon.
      The console and debugger are, for now, held on pre-release channels, and part of the things we want to fix before we enable them everywhere is performance.

      In terms of missing features: same here, we want to make sure the console and debugger are at feature-parity with the older versions before turning them on everywhere.
      I believe the mouse-over variable inspector is being implemented right now: https://github.com/firefox-devtools/debugger.html/issues/1574

      February 9th, 2017 at 04:54

  13. John Bilicki

    I love the keyboard accessibility, there is no universal all-the-time-keyboard or all-the-time-mouse answer, it’s subjective to the given situation which device is faster to interface with.

    I switched to Firefox 53 Nightly for multi-processor support (and I’d really like to see it land for ESR as I do NOT update every 42 days). A bug that is really annoying is when I click to view the line of code from a JavaScript error about 90% of the time the debugger does NOT scroll and highlight and that in turn brought my attention to the dinky-sized scrollbar which while cool looking might be appropriate if we were running CGA screens.

    Also after spending five days to mostly get my new Firefox theme under control I noticed that all of the “native themes” are actually melted in to the code directly **INSTEAD** of added as addon themes. All those “native looking” themes and **ALL** of the extensions should be listed as addons otherwise the purpose of having addon support is pretty much negated.

    Lastly I’d like to have a direct button for opening Developer tools (especially the Console) instead of having to two-click the Developer drop-down button/menu. That should be implemented as part of the Web Developer extension though so non-developer users won’t see those buttons.

    Besides that I’ve noticed a considerable improvement in performance and general usability over Firebug. Thanks to all involved for their hard work!

    February 10th, 2017 at 01:01

    1. Patrick Brosset

      Thanks for the great feedback John.
      The annoying console/debugger bug you mentioned is most probably related to our source-map support, which we are fixing right now. The work is tracked in this bug: https://bugzilla.mozilla.org/show_bug.cgi?id=1339970 and we have someone working on this now. So hopefully this should get much better soon.

      February 17th, 2017 at 02:10

Comments are closed for this article.