
Following the announcement of Web Push in Firefox 44, we’re now delivering the capability to develop and debug service workers and push notifications code with DevTools using Firefox Developer Edition 47.
Here’s a screencast that demonstrates the features described in this post:
Or if you prefer text, keep reading!
about:debugging
Service workers do not behave exactly as normal web workers, and their lifecycle is different, so we can’t show them alongside normal scripts in the Debugger tab of DevTools.
Instead, we’ve added a new dashboard that will collect all registered service workers and shared workers, amongst other debuggable items such as Add-ons.
Therefore, our debugging adventure starts by going to about:debugging in a new tab, and clicking on the Workers tab on the left.

Alternatively, you can access this dashboard by going to the Tools ⇨ Web Developer ⇨ Service Workers menu, or by clicking on the toolbar menu, then Developer, and finally Service Workers.


Dashboard instant updates
The first time we access the dashboard “nothing yet” will be displayed under the Service Workers and Shared Workers sections. These sections will be updated automatically as workers get registered. The displayed buttons will change accordingly, showing Push and Debug if the worker is running, or just a Start button if the worker is registered, but inactive.
Try it! Open about:debugging in one window, and navigate to this simple service worker demo in another window. The service worker will be registered and displayed under the Service Workers section. No need for you to reload the dashboard!
Debugging service workers
To debug a service worker, the worker must already be running. Click on the associated Debug button, or Start the worker if it’s not running yet (as long as it has been registered, and thus is in the about:debugging Dashboard).
This will pop up a new window with the code of the service worker. Here you can do all the usual debugging you would expect: setting breakpoints, step-by-step execution, inspecting variables, etc.

Push notifications
Code that uses the Web Push API can now be debugged as well, by setting a breakpoint in the listener for the push event of the service worker. When the push notification is received, the debugger will stop at the breakpoint.

This is very handy, but sometimes notifications can be delayed for reasons outside of our control, or the network might be temporarily unreachable. Luckily, you can still test code that relies on push events, by pressing the Push button on the worker.
This will send a push payload, and in turn, it will trigger the push event pretty much instantly. You can reduce your development time as you won’t have to wait for the server to deliver the push.
Debugging shared workers
There’s also support for debugging shared workers. The most important difference is that they will show up in their own dedicated section in about:debugging.
Debugging requests (and cached requests)
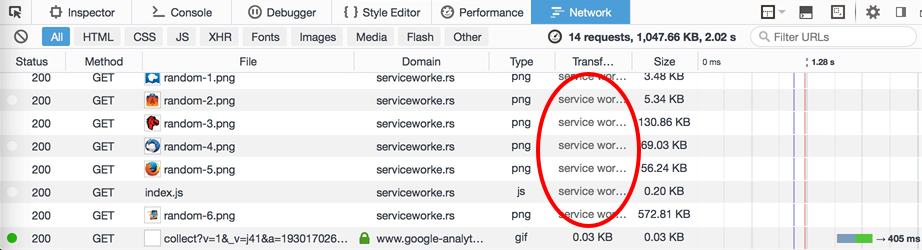
You can also now distinguish normal network requests from requests cached by the worker. These cached requests are displayed as Service Worker in the Transferred column, instead of displaying the amount of transferred data.
Requests initiated by service workers can be intercepted and debugged by setting a breakpoint on the fetch event listener.

We can inspect data such as the requested url, http headers, etc., by looking at the event object in the variables list when the debugger stops at the breakpoint.
Wrap up
Hopefully, this provides a good overview of the new features we’re working on.
The reference documentation for about:debugging is on MDN. If you want to learn more about service workers, you should check out the guide to Using Service Workers, and, of course, the Service Workers cookbook, which is loaded with great demos and examples.
About Soledad Penadés
Sole works at the Developer Tools team at Mozilla, helping people make amazing things on the Web, preferably real time. Find her on #devtools at irc.mozilla.org
4 comments