
Firefox 40 was just uplifted, and we have a lot of updates to share. This release took a major effort by Developer Tools contributors to address feedback we’ve heard directly from people using our tools. Grab a copy of the Developer Edition browser and check it out.
Experimental Multi-process Support: A Request
When you update to Developer Edition 40, you’ll be prompted to opt in to test multi-process Firefox. Please consider helping us test this new feature and providing feedback around any issues you see.
New in the Inspector
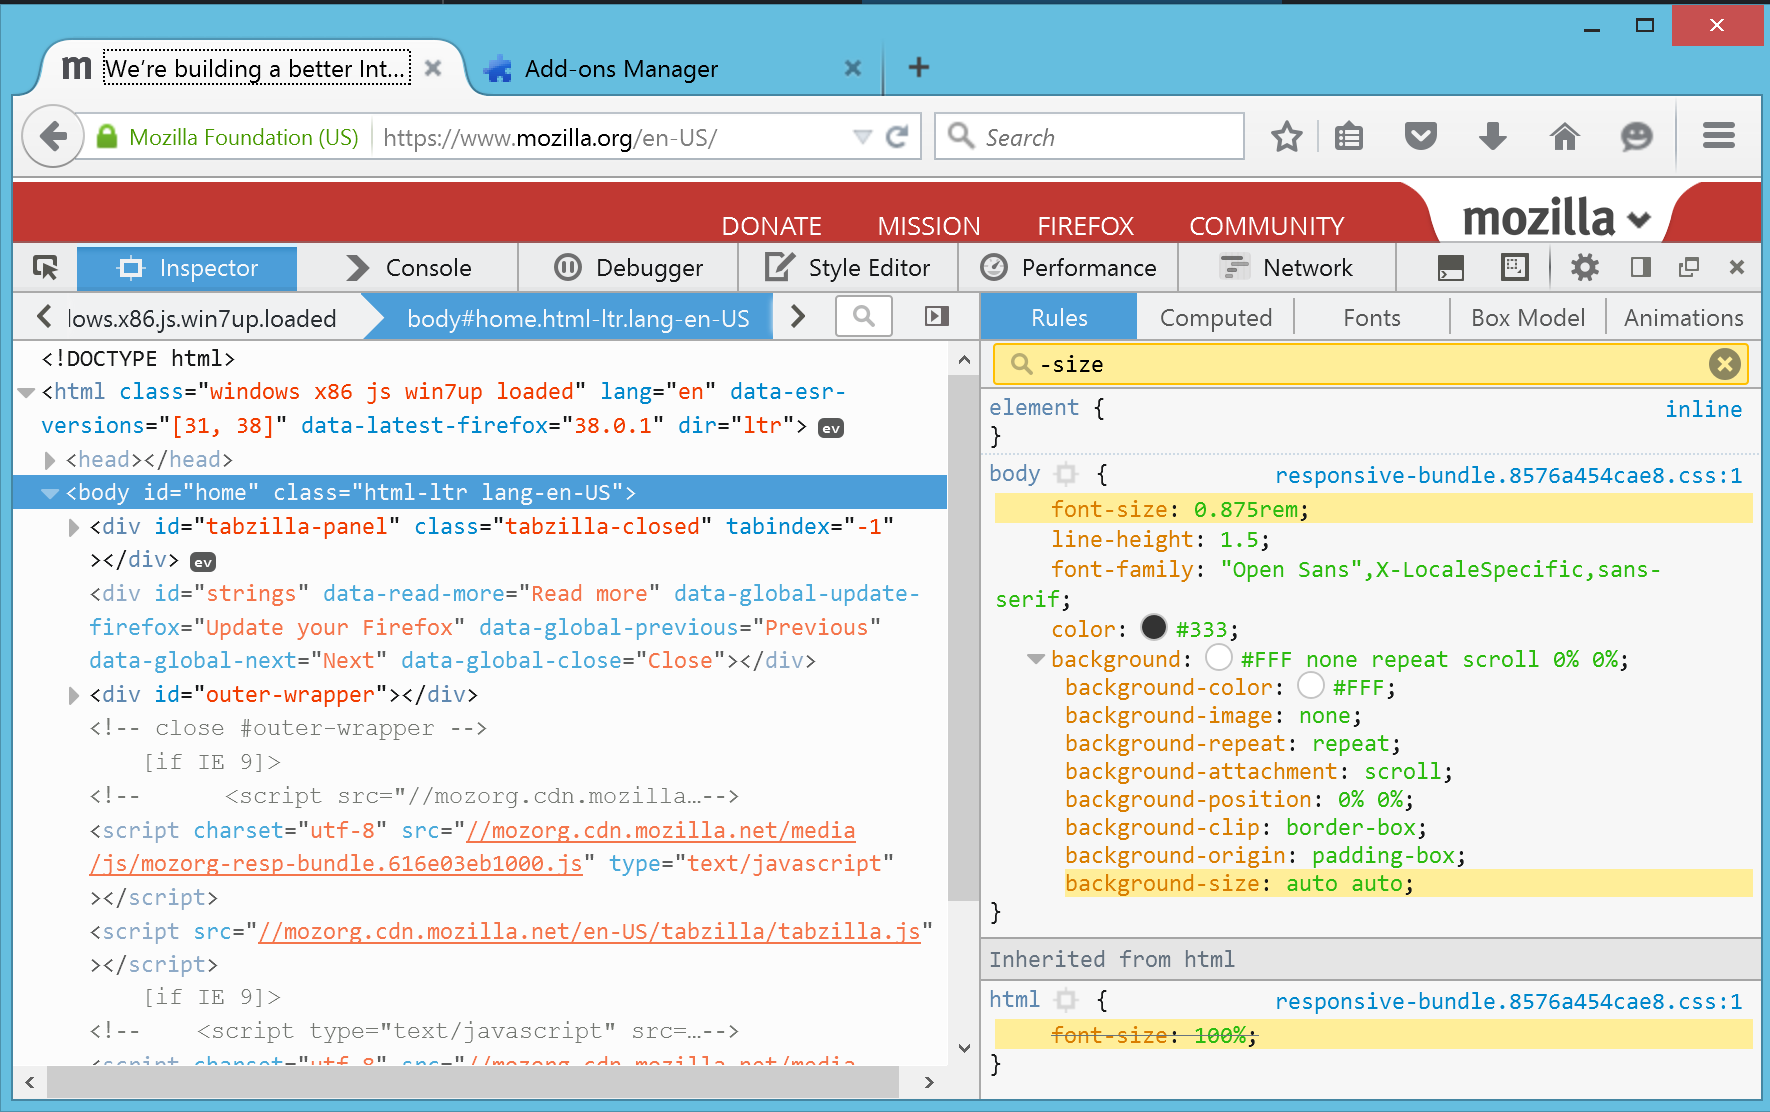
- There is now a filter box in the CSS Rules view that lets you find rules that match a string. See the Filter Styles screencast or the screenshot below. (Development notes: 1120616 and 1157293.)
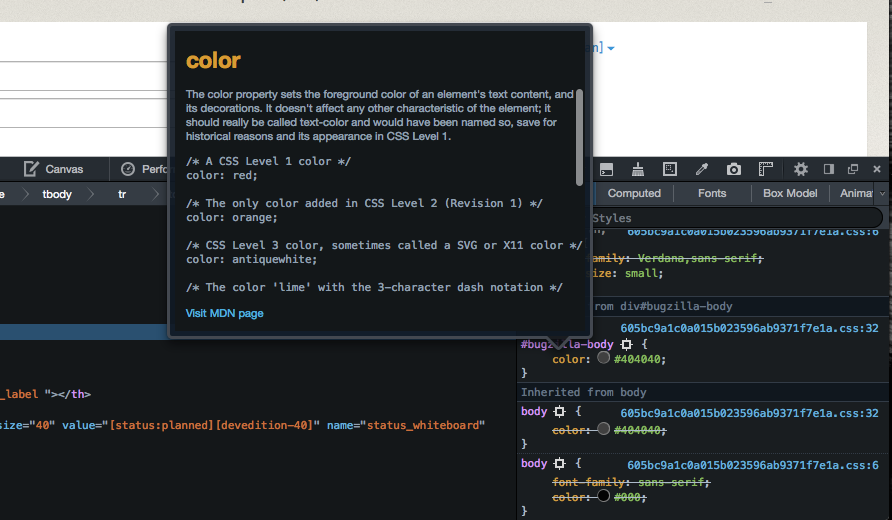
- There is a new CSS documentation tooltip for CSS properties. Right click on any property in the CSS Rules view and select “Show MDN Docs” to see more information about that property. (Development notes.)
- Inspector search now includes results from iframes and also includes class / id results without the CSS prefix. (Development notes: 873443 and 1149346.)
- There is a new CSS Filter Editor Tooltip added by Mahdi Dibaiee. Check out the CSS Filter Editor Tooltip screencast for a demo, or try it on the filter demos page in Developer Edition. (development notes)
- The Animation Inspector has had some major updates. It now shows subtree animations, playback rate can be controlled, and it previews and highlights animated DOM nodes. (Development notes: 1155651, 1155653, and 1144615.)
There are too many changes to list in this post, but here are a few more interesting updates you may come across in the Inspector:
- The Box Model view has legends for the regions and tooltips to show which CSS rule invoked the computed value. (Development notes: 1141571 and 1151956.)
- shift+clicking a color swatch switches between color unit formats in place. (Development notes.)
- New Scroll Into View, Open Link in New Tab, Copy Link, Open In Style Editor, and Open in Debugger context menu items in the Markup View. (Development notes: 901250, 921102, and 1158822.)
Network Monitor News
- One of the top requests in our UserVoice feedback channel has been to make the network panel always active once the toolbox is opened. We are happy to say you no longer need to switch to this panel to begin recording network traffic. (Development notes.)
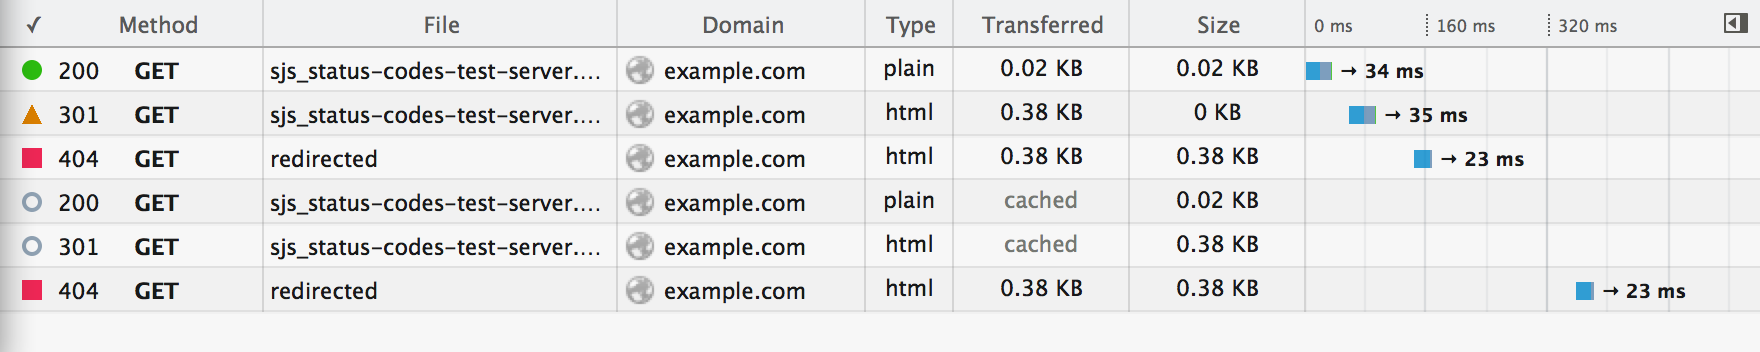
- Cached network requests now show up in the Network Monitor. (Development notes.)
Here’s a selection of other changes and improvements in this release:
- New Copy Response, Copy URL parameters, and Copy Request/Response Headers context menu items on each request. (Development notes: 955933, 1150717, and 1150715.)
- Search box to filter requests. (Development notes.)
- IP address included in Domain tooltip for network monitor. (Development notes.)
- Added access keys to the request context menu. (Development notes.)
Web Console
- New console method:
console.dirxml(). (Development notes.) - New filter options in the web console to show console messages from workers. (Development notes.)
- Quotes in strings are no longer added if logged via console.log. Thanks to new contributor Dmitry Sagalovskiy for adding this feature! (Development notes.)
Debugger
- New Copy URL and Open in New Tab context menu items for debugger sources. (Development notes.)
- Breaking in unnamed eval scripts now works. (Development notes.)
General
- Open Link In New Tab item is now added to sheets in the Style Editor. (Development notes.)
- There is a button to collapse the Inspector sidebar completely. (Development notes.)
- The Developer toolbar matches the light devtools theme when applied. (Development notes).
- Refreshed theme colors for better contrast. (Development notes.)
- Better HiDPI support for Windows. (Development notes: 1147702 and 1023546.)
Special thanks to all the people who contributed patches to Firefox Developer Tools this release! Here is a list of all the DevTools bugs resolved for Firefox 40. Kudos to the many contributors.
Do you have feedback, bug reports, feature requests, or questions? As always, you can comment here, get in touch with the team at @FirefoxDevTools, or share your constructive feedback and feature requests on our Firefox Dev Tools feedback channel.
7 comments