
Editor’s Note: Thanks to everyone who took the time to share constructive feedback and ideas for Firefox Devtools via our UserVoice channel. This forum is no longer available. We’ve decided to move the conversation over to the mozilla.dev.developer-tools Google group, where the conversation is lively, and Firefox DevTools team members are available to answer questions and respond to comments. See you there! (March 2016).
Every tool starts with an idea: “if I had this, then I could do that faster, better, or more easily.” The Firefox Developer Tools are built atop hundreds of those ideas, and many of them come from people in the web development community just like you.
We collect those ideas in our UserVoice forum, and use your votes to help prioritize our work.
Last April, @hopefulcyborg requested the ability to “Connect Firefox Developer Tools to [Insert Browser Here].” The following November, we launched Firefox Developer Edition which includes a preliminary version of just that: the ability to debug Chrome and Safari, even on mobile, from Firefox on your desktop. We called it Valence.
Good ideas don’t have to be big or even particularly innovative as long as they help you accomplish your goals more effectively. For instance, all of the following features also came directly from feedback on our UserVoice forum:
- In Firefox 39, we’ll ship drag-and-drop reordering of DOM nodes in our inspector.
- In Firefox 38, we began displaying more helpful CORS errors and demarcating XHRs in our console.
- In Firefox 37, we changed our inspector colors to be more usable by folks with color vision limitations.
- In Firefox 34, we added a panel dedicated to examining web storage.
- In Firefox 31, we incorporated an eyedropper tool into our style inspector.
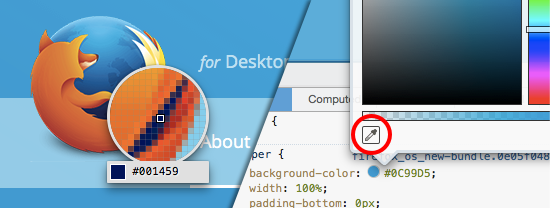
The color picker introduced in Firefox 31
Though somewhat small in scope, each of those ideas made the DevTools more efficient, more helpful, and more usable. And that’s our mission: we make Firefox for you, and we want you to know that we’re listening. If you have ideas for the Firefox Developer Tools, submit them on UserVoice. If you don’t have ideas, vote on the ones that are already there. The right people will see it, and it will help us build the best tools for you.
If you want to go a step further and contribute to the tools yourself, we’re always happy to help people get involved. After all, Mozilla was founded on the open source ideal of empowering communities to collaborate and improve the Internet for all of us.
These are your tools. How could they be better?
About Dan Callahan
Engineer with Mozilla Developer Relations, former Mozilla Persona developer.
27 comments