
A handful of bug fixes, improvements and some new features, of course, just landed in Firefox 37. Update your Firefox Developer Edition, or Nightly builds to try them out!
Animation Inspector Panel
A new API that’s quickly gaining traction is the Web Animations API, allowing developers to construct more complex animations using web technologies, rather than proprietary plugins. The foundation for animation tooling has begun in Firefox’s Developer Tools, with the first release revealing play/pause controls and a timeline scrubber. When selecting an element in the Inspector, an animations panel is now available alongside the rules, fonts, and other panels, if the element contains animations. Check out other videos of the animation inspector in action, or try it yourself in this web animation demo.
This is the first iteration of the web animation tools, and we are looking to hear from you on where we should go with this, and what we should build! Share detailed feedback with us on UserVoice, leave us a comment right here, or tweet to @FirefoxDevTools. (More detail on how to reach us in the closing paragraph below.)
Security Panel
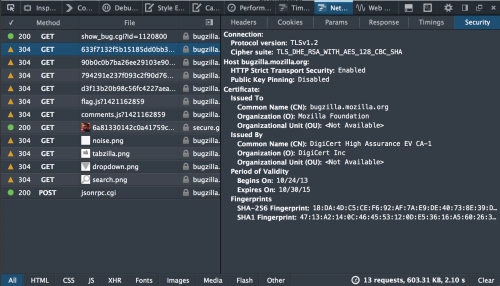
The Network Monitor is the home of our other new tool, the security panel. Selecting a request in the network panel now displays a security panel in the request inspector. The panel reveals a list of information about the request’s connection, host, as well as the certificate used.
The security panel can help debug issues related to SSL protocol versions, such as sites not working because of the POODLEBITE issue, and can help ensure that sufficiently strong security measures are implemented.
Some other features and small improvements in this release:
- Font inspector now shows all fonts (including fonts in iframes) when clicking “show all fonts” button. (Bug 1097150)
- Addons can now register custom actors. (Bug 1107888)
- The inspector sidebar now loads and refreshes lazily, leading to better performance of the inspector. (Bug 1103993)
- Box Model Highlighter colors have been updated so they are easier to see on a wider range of backgrounds, as well as more accessible. (Bug 989053)
- A new Firefox CLI option was added, –start-debugging-server, for starting the Firefox debugging server on a specific port. (Bug 1119894)
- The tools tabbar height has decreased to allow more vertical space in the toolbox. (Bug 1109288)
As we mentioned above, your feedback guides our priorities. Add your comments here, talk to us on Twitter @FirefoxDevTools, or propose changes on the Developer Tools feedback channel. If you’d like to help out with Dev Tools, check out the guide to getting involved.
About Jordan Santell
Mozillian, audio tools & SDK hacker, web audio nerd, metal head
2 comments