Introducing the Web Audio Editor in Firefox Developer Tools

In Firefox 32, the Web Audio Editor joins the Shader Editor and Canvas Debugger in Firefox Developer Tools for debugging media-rich content on the web. When developing HTML5 games or fun synthesizers using web audio, the Web Audio Editor assists in visualizing and modifying all of the audio nodes within the web audio AudioContext.

Visualizing the Audio Context

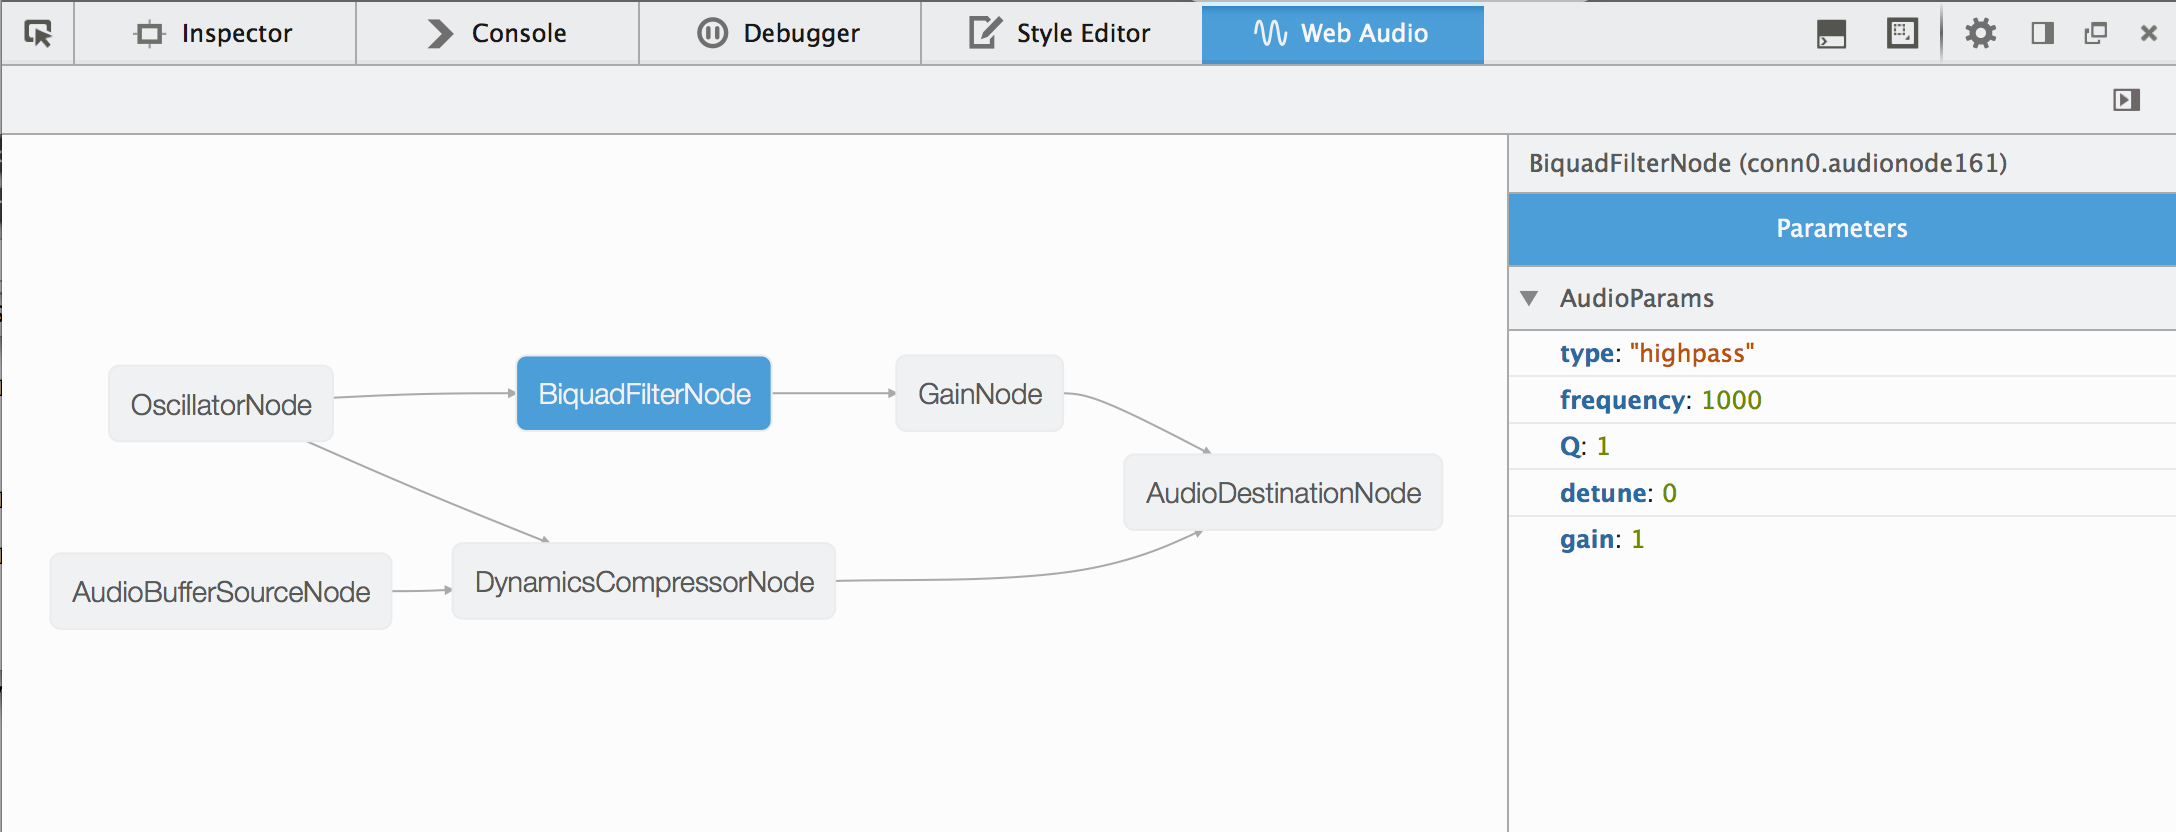
When working with the Web Audio API‘s modular routing, it can be difficult to translate how all of the audio nodes are connected just by listening to the audio output. Often, it is challenging to debug our AudioContext just by listening to the output and looking at the imperative code that creates audio nodes. With the Web Audio Editor, all of the AudioNodes are rendered in a directed graph, illustrating the hierarchy and connections of all audio nodes. With the rendered graph, a developer can ensure that all of the nodes are connected in a way that they expect. This can be especially useful when the context becomes complex, with a network of nodes dedicated to manipulating audio and another for analyzing the data, and we’ve seen some pretty impressive uses of Web Audio resulting in such graphs!

To enable the Web Audio Editor, open up the options in the Developer Tools, and check the “Web Audio Editor” option. Once enabled, open up the tool and reload the page so that all web audio activity can be monitored by the tool. When new audio nodes are created, or when nodes are connected and disconnected from one another, the graph will update with the latest representation of the context.

Modifying AudioNode Properties

Once the graph is rendered, individual audio nodes can be inspected. Clicking on an AudioNode in the graph opens up the audio node inspector where AudioParam‘s and specific properties on the node can be viewed and modified.

Future Work

This is just our first shippable release of the Web Audio Editor, and we are looking forward to making this tool more powerful for all of our audio developers.

  • Visual feedback for nodes that are playing, and time/frequency domain visualizations.
  • Ability to create, connect and disconnect audio nodes from the editor.
  • Tools for debugging onaudioprocess events and audio glitches.
  • Display additional AudioContext information and support multiple contexts.
  • Modify more than just primitives in the node inspector, like adding an AudioBuffer.

We have many dream features and ideas that we’re excited about, and you can view all open bugs for the Web Audio Editor or submit new bugs. Be sure to check out the MDN documentation on the Web Audio Editor and we would also love feedback and thoughts at our UserVoice feedback channel and on Twitter @firefoxdevtools.

About Jordan Santell

Mozillian, audio tools & SDK hacker, web audio nerd, metal head

More articles by Jordan Santell…

About Robert Nyman [Editor emeritus]

Technical Evangelist & Editor of Mozilla Hacks. Gives talks & blogs about HTML5, JavaScript & the Open Web. Robert is a strong believer in HTML5 and the Open Web and has been working since 1999 with Front End development for the web - in Sweden and in New York City. He regularly also blogs at http://robertnyman.com and loves to travel and meet people.

More articles by Robert Nyman [Editor emeritus]…


16 comments

  1. Carl Sutherland

    What library is used for the graph layout?

    June 18th, 2014 at 11:07

    1. Jordan Santell

      Currently using D3[1] for rendering, and dagre[2] for computing positions of items in an directed acyclic graph. We’d like to remove the D3 dependency and natively do our own rendering in SVG like the other tools, and experiment with different ways of rendering the graph (like visualizing an AudioNode connected to another node’s AudioParam, for example).

      [1] http://d3js.org/
      [2] https://github.com/cpettitt/dagre

      June 18th, 2014 at 11:24

      1. Simon Speich

        Maybe this graph library might be of help https://github.com/speich/dGraph

        June 25th, 2014 at 03:22

      2. Jan

        Out of curiosity, why do you want to get rid of the D3 dependency? Just to be consistent with the other tools or is there a restriction in D3 or somewhat? We’re about to use D3 in a new project.

        June 29th, 2014 at 13:52

  2. Dominik

    This is really cool, but when will the Dev Tools get something to help debug rendering performance issues like Chrome’s Timeline?

    June 18th, 2014 at 12:23

    1. Paul Rouget

      We’re looking at this. We have engineers working on tools to monitor gecko performances.

      June 18th, 2014 at 12:37

      1. Dominik

        Great, looking forward to them!

        June 19th, 2014 at 02:48

    2. K. Gadd

      The SPS profiler addon (https://developer.mozilla.org/en-US/docs/Mozilla/Performance/Profiling_with_the_Built-in_Profiler) has a really detailed sampling mode that shows a simple timeline up top with markers for rendering, frame boundaries, etc along with markers for GCs and recompiles. So far it has been incredibly useful for debugging rendering performance; for me it’s more useful than Chrome’s profiler, despite the lack of feature parity.

      June 18th, 2014 at 18:13

      1. Dominik

        Will check it out, thanks!

        June 19th, 2014 at 02:49

  3. Alex

    Just checking out the Web Audio Editor with a game I’ve been working on. Each time I play a sound I have to create a new AudioBufferSourceNode and a gain node to go with it. My Web Audio panel is quickly littered with orphaned AudioBufferSourceNode instances! Do these normally hang around in memory like that? I can’t see a destroy method for them anywhere and I’m pretty sure I’ve nulled all references once the sounds finish playing. Or is it just the Web Audio panel itself that is making them persist?

    June 20th, 2014 at 04:31

    1. Jordan Santell

      Clearing out nodes that have been GC’d has been a lot of work, but should be ready in the next release (Fx33) — this is very important for the use case of lots of AudioBufferSourceNodes being created, just like you’re running into! This will also help to confirm whether or not your nodes are being cleaned up properly (are there any strong references to them? were they disconnected from the context?)

      Follow bug 994263 [1] for the front end reflecting these changes and hiding GC’d nodes

      [1] https://bugzilla.mozilla.org/showdependencytree.cgi?id=994263&hide_resolved=0

      June 20th, 2014 at 10:25

      1. Alex

        Nice one, looking forward to trying out the updated version and seeing my GC’d nodes disappear! As it is the tool has already been useful in showing me some mistakes in my code, many thanks for this.

        June 20th, 2014 at 10:49

        1. Jordan Santell

          Great to hear! If you’re interested in the latest features, maybe check out the Nightly[1] builds, which will always have the latest and greatest in the tool.

          [1] http://nightly.mozilla.org/

          June 20th, 2014 at 16:24

          1. Alex

            Oh cool I will try using the nightly then – thanks for the tip.

            June 20th, 2014 at 23:02

  4. Anthony Baxter

    Wow this is awesome, great work

    June 21st, 2014 at 20:26

  5. Ukash Kart

    We have engineers working on tools to monitor gecko performances

    July 1st, 2014 at 07:34

Comments are closed for this article.