Live Editing Sass and Less in the Firefox Developer Tools

Sass and Less are expressive languages that compile into CSS. If you’re using Sass or Less to generate your CSS, you might want to debug the source that you authored and not the generated CSS. Luckily you can now do this in the Firefox 29 developer tools using source maps.

The Firefox developer tools use source maps to show the line number of rules in the original source, and let you edit original sources in the Style Editor. Here’s how to use the feature:

1. Generate the source map

When compiling a source to CSS, use the option to generate a sourcemap for each style sheet. To do this you’ll need Sass 3.3+ or Less 1.5+.

Sass

sass index.scss:index.css --sourcemap

Less

lessc index.less index.css --source-map

This will create a .css.map source map file for each CSS file, and add a comment to the end of your CSS file with the location of the sourcemap: /*# sourceMappingURL=index.css.map */. The devtools will use this source map to map locations in the CSS style sheet to locations in the original source.

2. Enable source maps in developer tools

Right-click anywhere on the inspector’s rule view or in the Style Editor to get a context menu. Check off the Show original sources option:

Enabling source maps in devtools

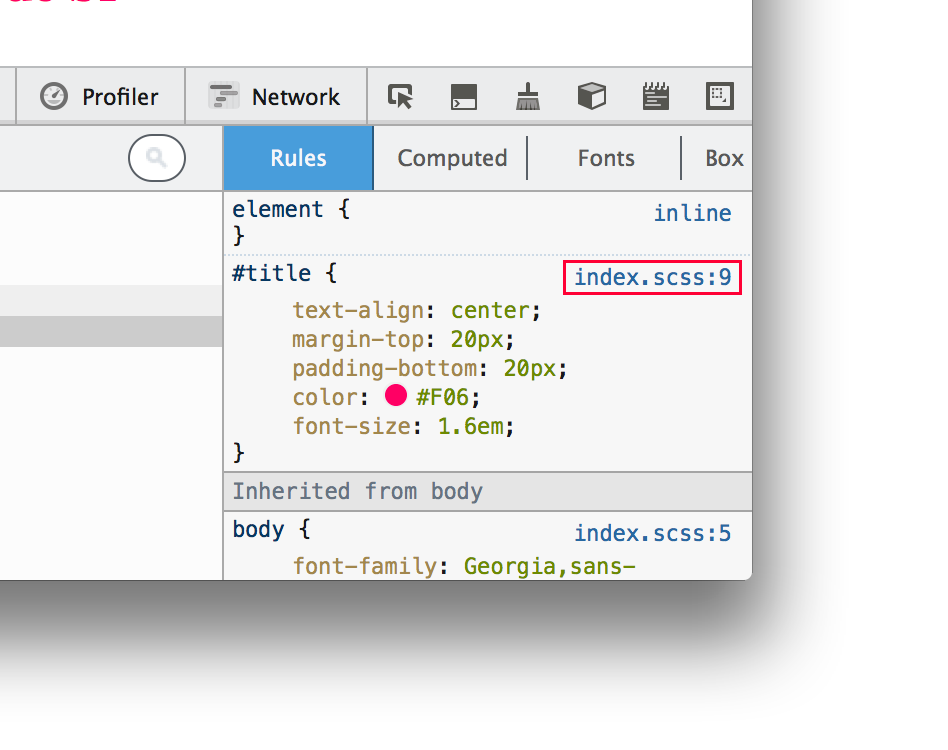
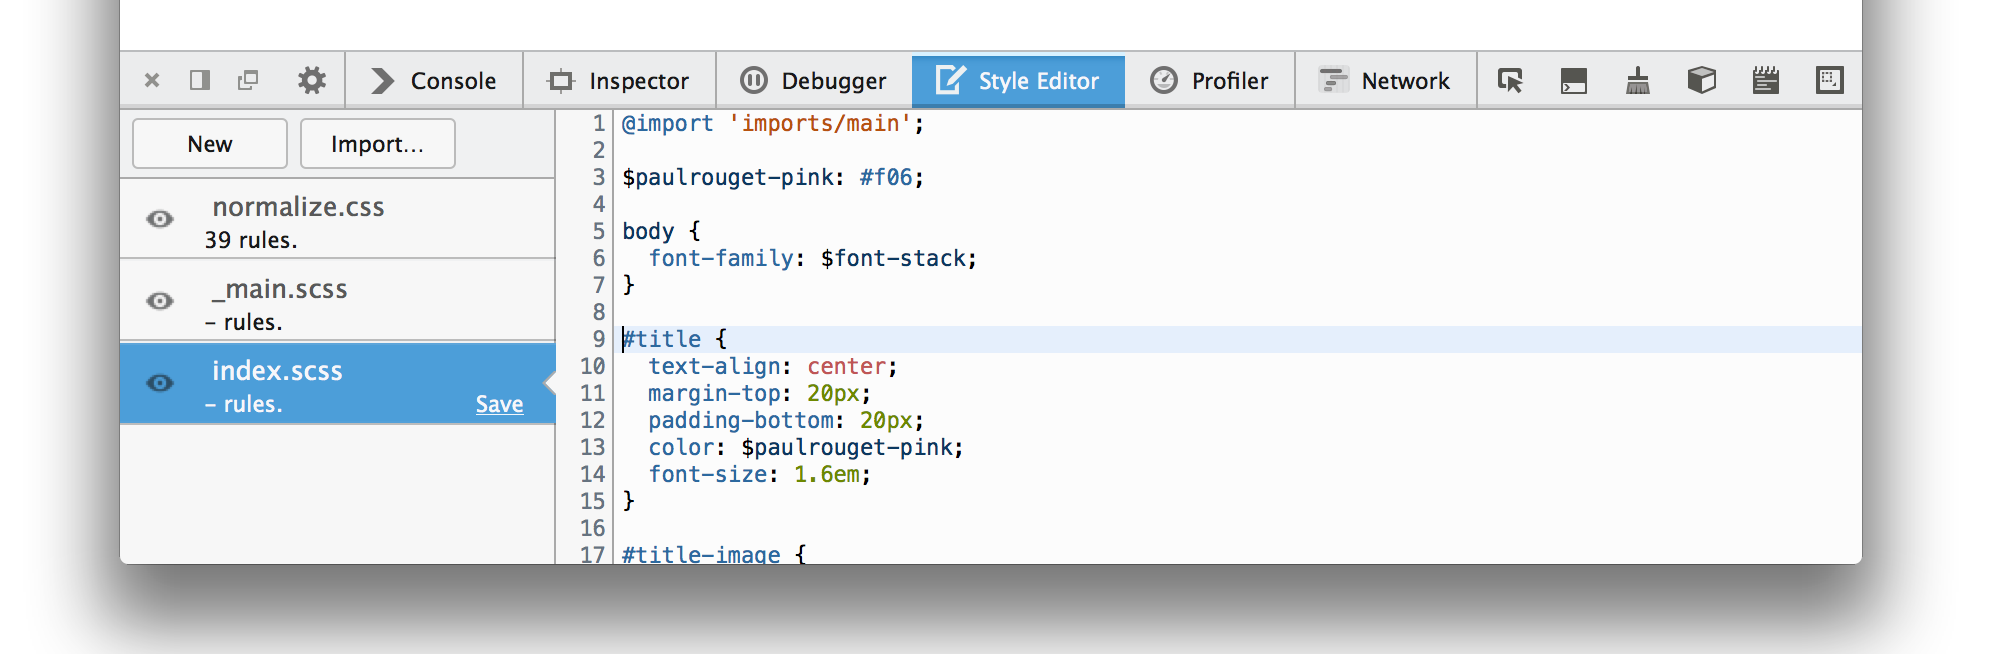
Now CSS rule links will show the location in the original file, and clicking these links will take you to the source in the Style Editor:

Original source showing in Style Editor

3. Set up file watching

You can edit original source files in Style Editor tool, but order to see the changes apply to the page, you’ll have to watch for changes to your preprocessed source and regenerate the CSS file each time it changes. To set watching up:

Sass

sass index.scss:index.css --sourcemap --watch

Less

For Less, you’ll have to set up another service to do the watching, like grunt.

4. Save the original source

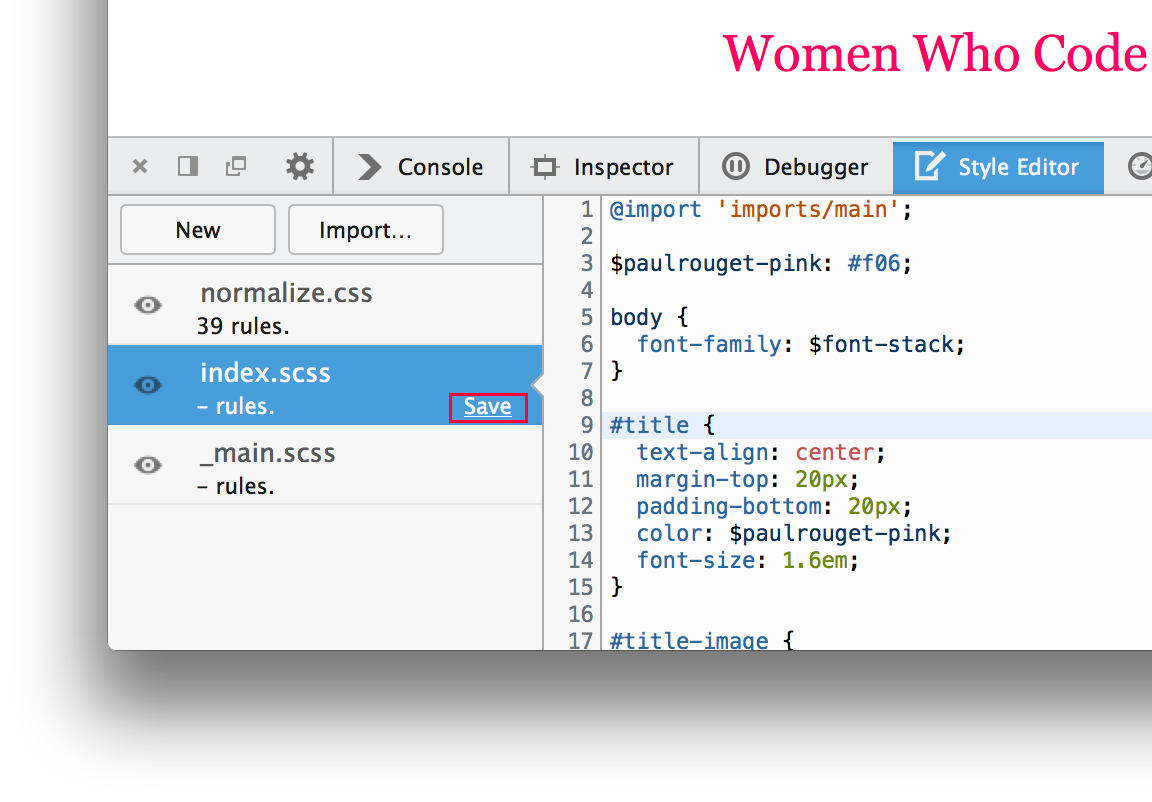
Save the original source to your local file system by hitting the Save link or Cmd/Ctrl-S:

Saving source to disk

Saving source to disk

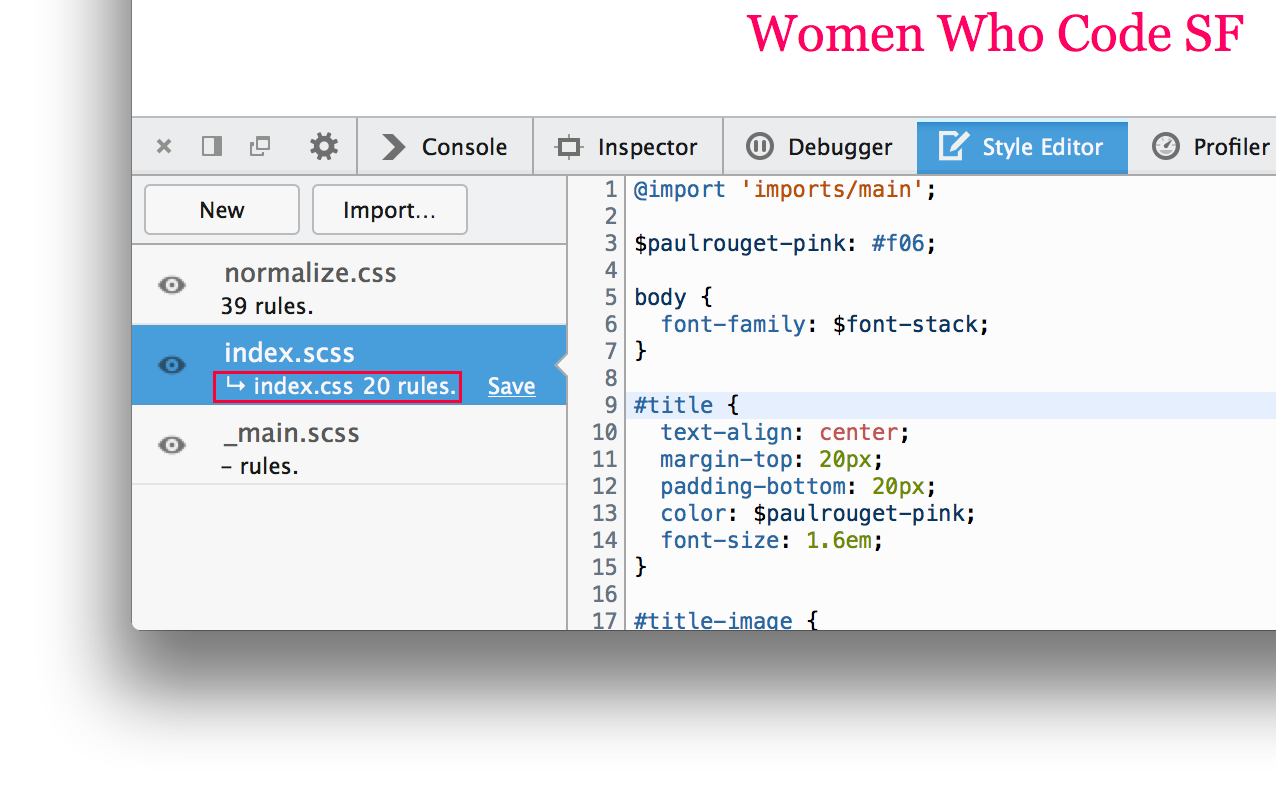
The devtools will infer the location of the generated CSS file locally and watch that file for changes to update the live style sheet on the page.

Now when you edit an original source and save it, the page’s style will update and you’ll get immediate feedback on your Sass or Less changes.

The source has to be saved to disk and file watching set up in order for style changes to take effect.

About Heather Arthur

Firefox developer tools developer at Mozilla, working mainly on the style tools.

More articles by Heather Arthur…

About Robert Nyman [Editor emeritus]

Technical Evangelist & Editor of Mozilla Hacks. Gives talks & blogs about HTML5, JavaScript & the Open Web. Robert is a strong believer in HTML5 and the Open Web and has been working since 1999 with Front End development for the web - in Sweden and in New York City. He regularly also blogs at http://robertnyman.com and loves to travel and meet people.

More articles by Robert Nyman [Editor emeritus]…


32 comments

  1. Mihai Chereji

    Nice! The FF Dev tools are really starting to give more mature solutions a run for their money.

    February 18th, 2014 at 10:18

  2. Jonas K

    Fantastic news. Actually I was thinking about sourcemaps and Firefox today.
    Thank you.

    February 18th, 2014 at 11:45

  3. Hai

    Just some feedback on the Theme.
    The DEV-Tools feels really heavy, as all widgets uses a lot of space due to paddings. Is there a plan to offer a Theme that let more space for the page content, especially on smaller screens?

    By the way great progress on the DEV Tools, unfortunately everyone is complaining about Firebug, as most developers does not know about the progress Mozilla made on the internal DEV-Tools.

    February 18th, 2014 at 12:04

    1. Brian Grinstead

      Hello, we are working on putting the theme on a padding diet here: https://bugzilla.mozilla.org/show_bug.cgi?id=915414. The overall paddings have already shrunk quite a bit for the 29 release, and there are just a couple of things remaining before we can shrink the secondary toolbar height. Please add a comment in the bug if you have thoughts about other things that are too big.

      February 18th, 2014 at 13:51

  4. Hai

    Hi Brian,
    I looked at the newest nightly that is really close to a real diet :-)

    I like really the “Toggle Split Console” Feature, but in my opinion the (console) menu bar should be hidden when using the console in the debugger window as it takes to much place.

    Another non Feature thing that would be nice if the API documentation could be extended, it would be also nice to read some lines about styling so that an Extension integrates well into the Dev Tool Theme.

    Thx for your reply

    February 18th, 2014 at 14:39

    1. Brian Grinstead

      We have talked about removing the console toolbar when in split mode, but ultimately decided that it could be confusing if your filters were not set up properly and you were missing log statements. So we decided to keep the bar. I think we should revisit at it after the slimmer toolbars land: https://bugzilla.mozilla.org/show_bug.cgi?id=942292, as they may be resolving the height problem anyway.

      February 18th, 2014 at 15:03

  5. Ben

    How do you get the little circles showing the colours to display in the Style Editor? Cannot see them in either Aurora or Nightly.

    February 18th, 2014 at 15:08

    1. Heather Arthur

      They just appear in the Inspector’s Rules section right now, unfortunately. Showing color swatches in the Style Editor is something that we want though.

      February 18th, 2014 at 15:27

  6. Matthew Balaam

    Is everybody able to get the page refresh to work? I am using the latest Aurora on Windows 7 and have my files are being automatically complied with Prepros, but I have to manually refresh to see any changes.

    Also, are there plans to have an options for edited files to automatically save in their current location without needing to locate it?

    February 19th, 2014 at 02:51

    1. Heather Arthur

      If you’ve followed the steps above and it’s not refreshing the styles on save, then it very well might be a bug.

      Check out Nightly (http://nightly.mozilla.org) as there are a couple of bug fixes in there. Otherwise file a bug if you can: https://bugzilla.mozilla.org/enter_bug.cgi?product=Firefox&component=Developer%20Tools%3A%20Style%20Editor.

      What do you mean by saving in their current location? Firefox can’t tell the location of the file on disk until you tell it. Do you mean after saving it to a location once that it should remember it?

      February 19th, 2014 at 11:37

      1. Matthew Balaam

        I have tried the nightly but it is still not updating so I will file a bug.

        I wasn’t thinking it through when I wrote the original, but perhaps there could be a way of mapping certain domains, e.g. localhost root could be set to the root of my development files?

        February 20th, 2014 at 02:02

        1. Heather Arthur

          Thanks for clarifying. Being able to set the root would be ideal. We’re thinking of a good UI for this kind of thing.

          February 20th, 2014 at 18:44

          1. Matthew Balaam

            I have tested this a bit further. If I try using WAMP instead of Tomcat as my server I do not see any live refreshes.

            I then tried a test on a static page loaded via the filesystem and changes are made, the reload happens immediate when Prepros compiles.

            I then tried Chrome which exhibited the same behaviour, but it does have a link in the history panel ‘apply original content’, which when clicked loads the new styles.

            My best guess is that there is some issue with my setup if everyone else is able to use this feature properly. If anyone has any ideas of what I can try to get this feature working properly that would be most appreciated.

            March 6th, 2014 at 01:48

  7. Camille Bissuel

    Nice work ! And stylus ?
    http://learnboost.github.io/stylus/

    February 19th, 2014 at 09:21

    1. Heather Arthur

      Stylus can’t generate source maps right now, so you can’t use this feature with it unfortunately.

      February 19th, 2014 at 11:10

      1. Camille Bissuel

        Obviously…
        Thanks for the answer anyway ;)

        February 20th, 2014 at 05:39

  8. Alex Bell

    Thanks Heather, you rock. It is so awesome to see FF dev tools embarking on its path to reclaim the almighty throne. Keep up the goodness.

    “Padding diet” is great, but I think there’s still some more decluttering that can be done. Almost all of the icons at the right of the main toolbar are debatable IMHO.

    – “pick an element” is redundant with right-click “Inspect”. It’s always just another trip back to the button to turn it off so I can scroll through the inspector rules. I hate it. Maybe just me.
    – JS Scratchpad is cool for education but I’ve never use it once for debugging. Maybe just me. Tuck it away in a menu.
    – 3D view. Again, bury it somewhere. So breathtakingly cool….and yet… so useless in production.
    – toggle split console button. Everyone knows it’s “ESC” for the mini console. A de facto standard. It’s a cool trick, but does it really need dedicated space in the UI?

    I could go on. I have a strong hunch I’m not the only person who feels this way. Don’t just copy Chrome, by all means. Innovation is great. But the devtools christmas tree still needs some pruning.

    February 19th, 2014 at 18:19

    1. Brian Grinstead

      Good idea – I’ve filed a bug for this: https://bugzilla.mozilla.org/show_bug.cgi?id=974947. IMO ‘pick an element’ and split console buttons should always be there, but the other 4 should be removable. Feel free to comment on the bug if you’d like to discuss further.

      February 20th, 2014 at 08:46

  9. Scott Gilbertson

    This is awesome. Or rather, this, combined with the support for Vim keybindings in the dev tools, beats Chrome by a long shot. Live editing Sass in the browser with Vim. And people actually purchase Dreamweaver.

    To go along with Alex Bell’s ideas, I’ve long thought developer tools should offer a preference that allows you to toggle on and off the features you want… Right now, especially docked to the side, trying to figure out which icon does what is a bit like deciphering hieroglyphs

    February 19th, 2014 at 18:35

  10. Ronan Jouchet

    Fantastic! Close to this feature but on the JS side, I’m loving Chrome’s filesystem/resource mapping & internal script reloading demoed at http://www.youtube.com/watch?v=O3W1yuq-ZlE#t=136 , is it planned for Firefox? Is there a bug where we can lurk on ongoing development?

    February 19th, 2014 at 19:07

    1. Heather Arthur

      As far as live JS editing goes, here’s a bug for you to follow: https://bugzilla.mozilla.org/show_bug.cgi?id=771339.

      Filesystem mapping is planned, but not well defined yet.

      February 20th, 2014 at 18:51

  11. Luke

    Nice! I assume this is only for local development though? Also, isn’t JS sourcemap working in one of these Firefox releases?

    February 19th, 2014 at 22:22

    1. Nick Fitzgerald

      Source maps have worked with js in the debugger for a long time.

      February 20th, 2014 at 18:58

    2. Heather Arthur

      Hi Luke, can you clarify what you mean by local development? Do you mean to ask if it works remotely debugging the page on a mobile device, or just debugging a page hosted on a server?

      JS source map support has been in since Firefox 23.

      February 20th, 2014 at 19:04

      1. Luke

        I mean these work with local scss files on the local testing setup.

        For JS sourcemap, I mean this feature (I knew I saw an article about it before): http://www.html5rocks.com/en/tutorials/developertools/sourcemaps/

        I assume there isn’t yet a way to use this JS sourcemap feature with local sourcemaps applied to remote JS files though?

        February 20th, 2014 at 23:32

  12. Jay

    Are there plans to support Sass’s native debug output?

    February 23rd, 2014 at 07:33

    1. Heather Arthur

      What do you mean by support? Is there something useful that you think the devtools could display?

      March 12th, 2014 at 01:21

  13. James

    Hi, I was wondering if there were plans to allow the console output to be altered at any point? The standard output at the moment is pretty useless in many cases, requiring either an extra “.toString()” after the command, wrapping it in “pprint()” or “inspect()”, or taking your hands off the keyboard and clicking the output.

    It would be nice to be able to specify custom formatters, and as far as I could tell the upcoming Dev Tools API doesn’t have anything like this. Being able to see useful output for commands (especially jQuery objects via FireQuery) is about the only thing currently stopping me using the new developer tools full-time.

    Thanks!

    March 10th, 2014 at 17:24

    1. Luke

      I doubt there will be an official API, but yes, this is definitely possible.

      I was experimenting changing the console output on the Devtools-tweaks webconsoleOutputBetter branch, which changes the console outputs:

      https://github.com/programmin1/DevTools-Tweaks/compare/master…webconsoleOutputBetter

      I also did a small fix for David Bruant’s experimental Useful-Stack-Trace Firefox addon recently, which makes the stack traces link directly to the original file, not Usefulstacktrace itself. That could serve as a working example:

      https://github.com/DavidBruant/usefulStackTrace/pull/10

      As a side-note, you should check out the Firefox Nightly (version 30), it has a much better display in Web Console! It shows the array for example, instead of just showing [object Array] and requiring a click.

      March 11th, 2014 at 21:53

      1. James

        I actually just checked and this machine still had FF 23, which means I haven’t updated it since I installed it… might have disabled auto-updates. Anyway, I’ve also installed Nightly, and while the new appearance is… interesting… not only can I can now see the difference between and empty array or jQuery instance, I can inspect their contents as well :)

        That’s better than I’d hoped for, thanks for letting me know – this will save a lot of frustration! :)

        March 12th, 2014 at 05:49

  14. Chris Eppstein

    Sass 3.3 was released. You don’t need the –pre to install sourcemap support anymore.

    March 11th, 2014 at 11:51

    1. Heather Arthur

      Thanks for the tip, Chris.

      March 11th, 2014 at 23:24

Comments are closed for this article.