
… or Cross-Browser Add-ons for Fun or Profit
Browser add-ons are clearly an important web browser feature, at least on the desktop platform, and for a long time Firefox was the browser add-on authors’ preferred target. When Google launched Chrome, this trend on the desktop browsers domain was pretty clear, so their browser provides an add-on api as well.
Most of the Web DevTools we are used to are now directly integrated into our browser, but they were add-ons not so long time ago, and it’s not strange that new web developer tools are born as add-ons.
Web DevTools (integrated or add-ons) can motivate web developers to change their browser, and then web developers can push web users to change theirs. So, long story short, it would be interesting and useful to create cross-browser add-ons, especially web devtools add-ons (e.g. to preserve the web neutrality).
With this goal in mind, I chose Ember Inspector as the target for my cross-browser devtool add-ons experiment, based on the following reasons:
- It belongs to an emerging and interesting web devtools family (web framework devtools)
- It’s a pretty complex / real world Chrome extension
- It’s mostly written in the same web framework by its own community
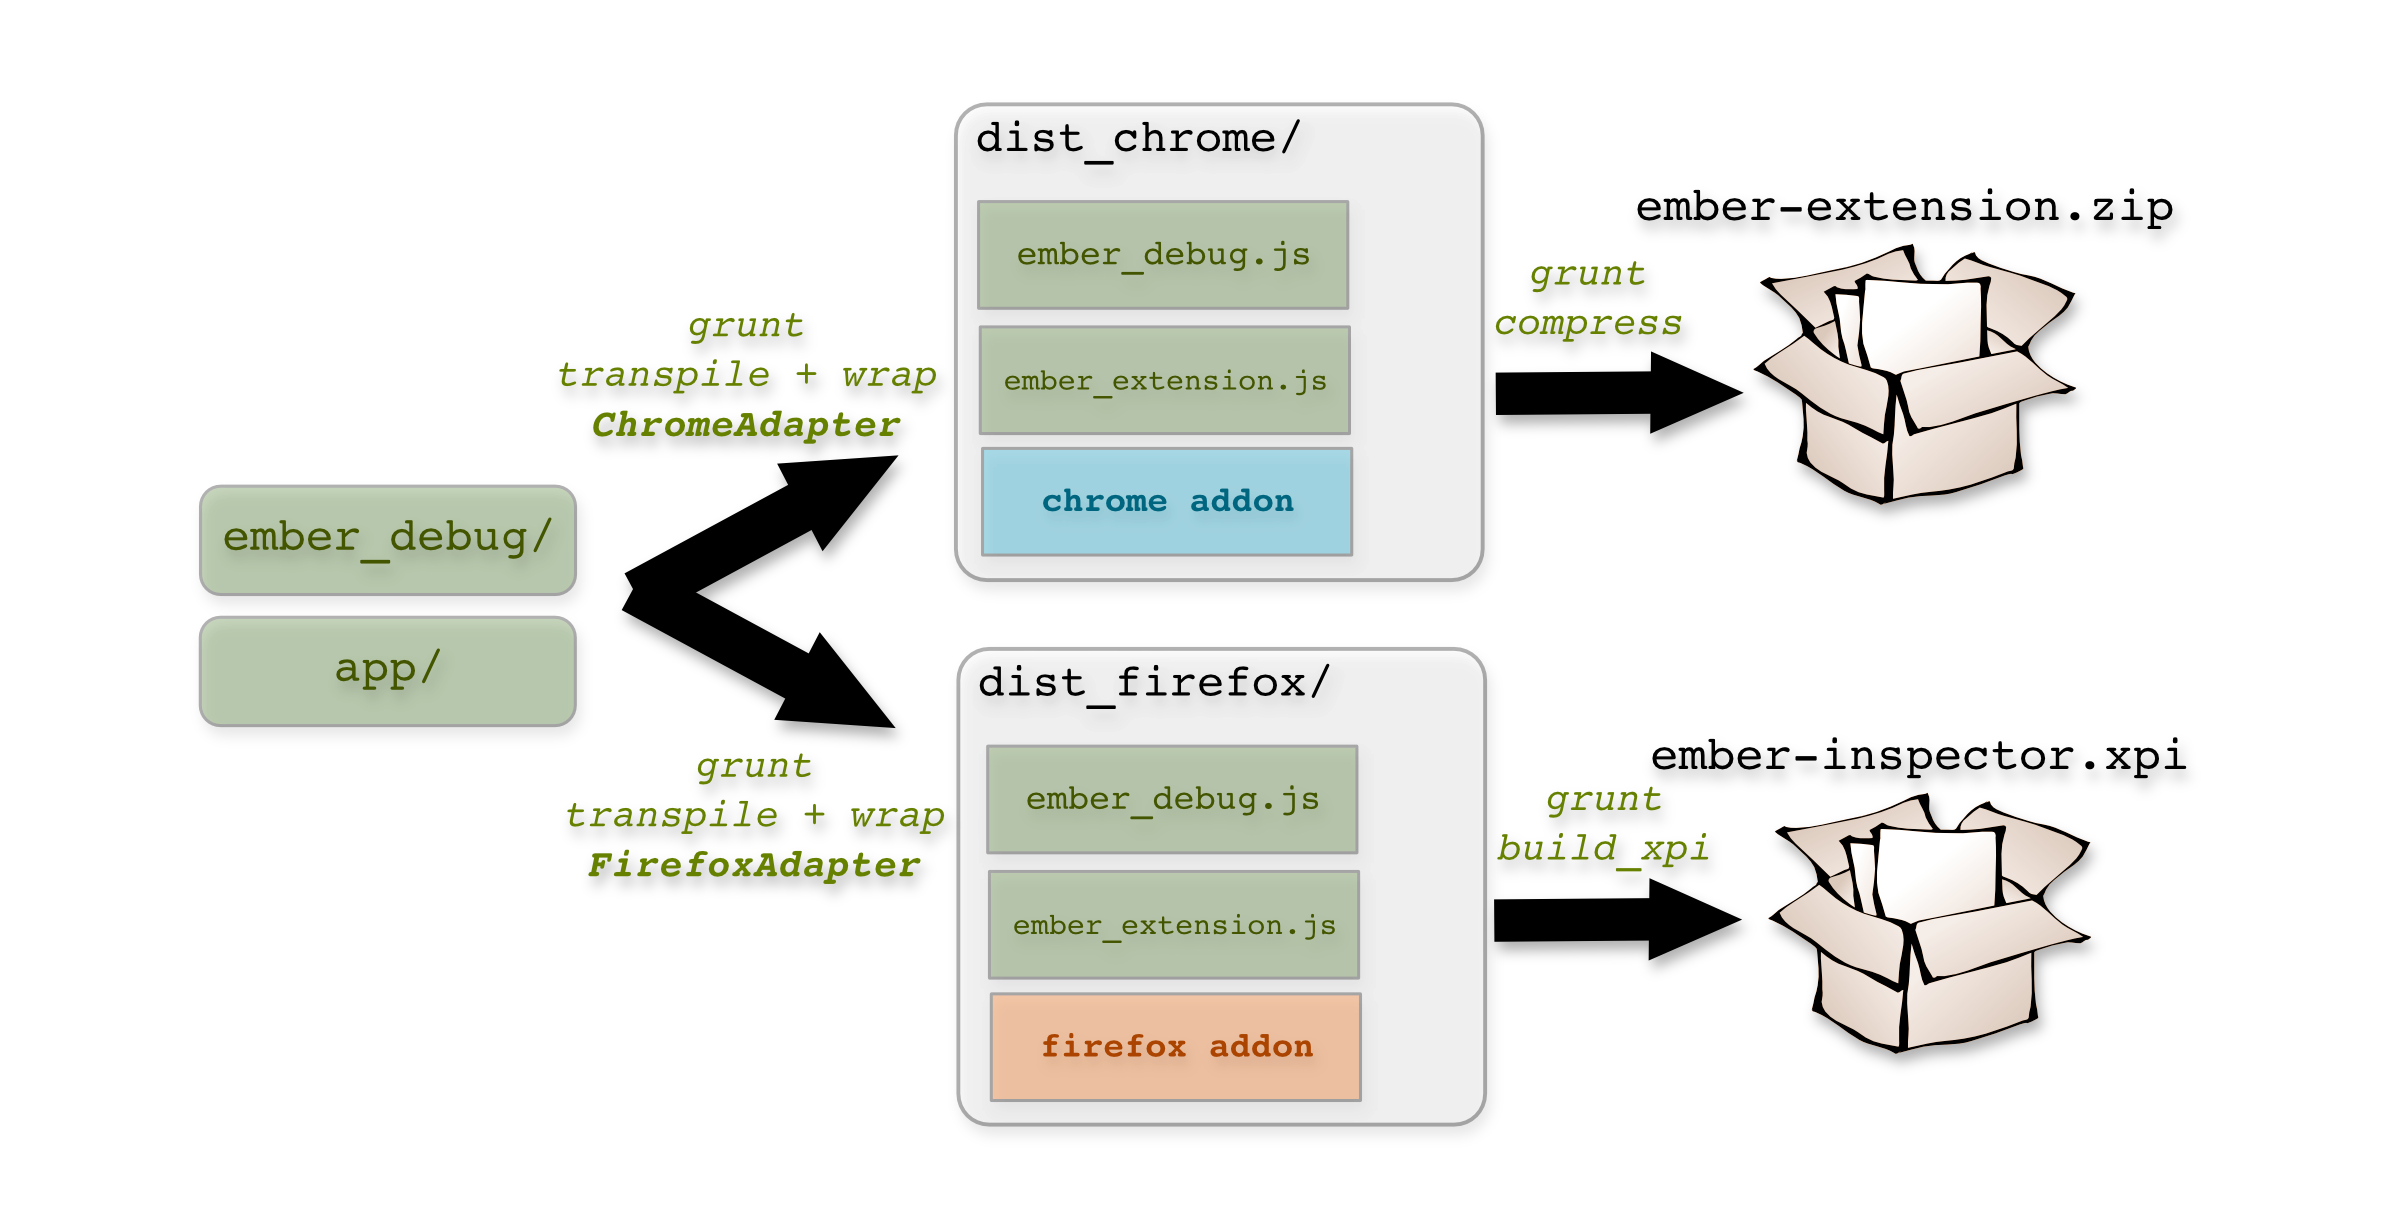
- Even if it is a Chrome extension, it’s a webapp built from the app sources using grunt
- Its JavaScript code is organized into modules and Chrome-specific code is mostly isolated in just a couple of those
- Create new Firefox add-on specific code (register a devtool panel, control the inspected tab)
- Polyfill the communication channel between the ember_debug module (that is injected into the inspected tab) and the devtool ember app (that is running in the devtools panel)
- Polyfill the missing non-standard inspect function, which open the DOM Inspector on a DOM Element selected by a defined Ember View id
- Minor tweaks (isolate remaining Chrome and Firefox specific code, fix CSS -webkit prefixed rules)
- Modular JavaScript sources which helps to keep browser specific code encapsulated into replaceable modules
- Devtool panel and code injected into the target tab collaborate exchanging simple JSON messages and the protocol (defined by this add-on) is totally browser agnostic
- DevTool Panel Content Script
- ember_extension.js FirefoxAdapter
- TargetTab Content Script
- ember_debug.js FirefoxAdapter
- Firefox (from AMO): https://addons.mozilla.org/en-US/firefox/addon/ember-inspector/
- Chrome (from Chrome WebStore): https://chrome.google.com/webstore/detail/ember-inspector/bmdblncegkenkacieihfhpjfppoconhi
Plan & Run Porting Effort
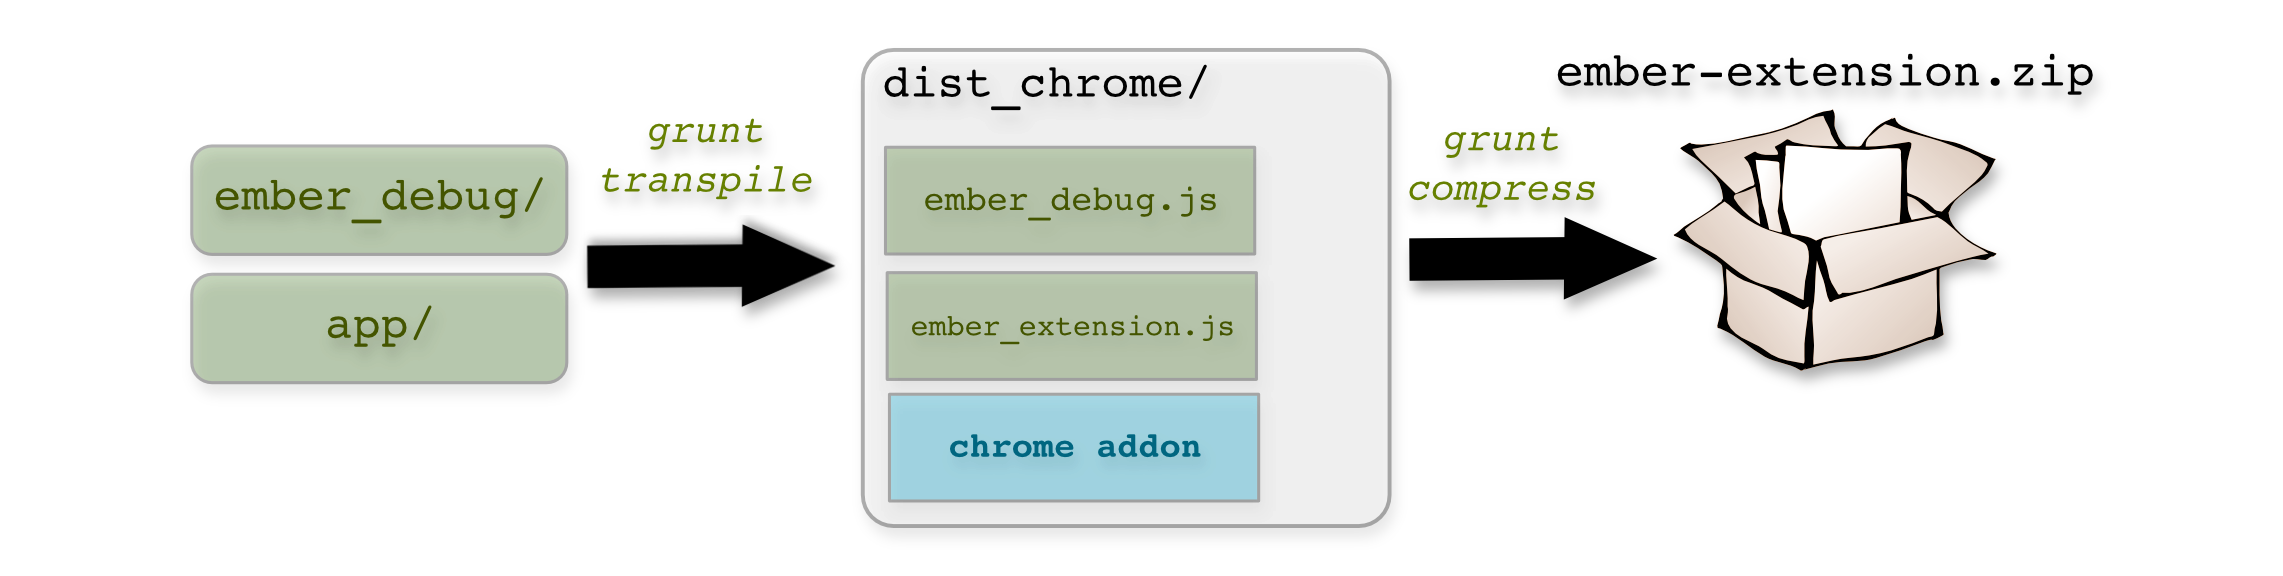
Looking into the ember-extension git repository, we see that the add-on is built from its sources using grunt:
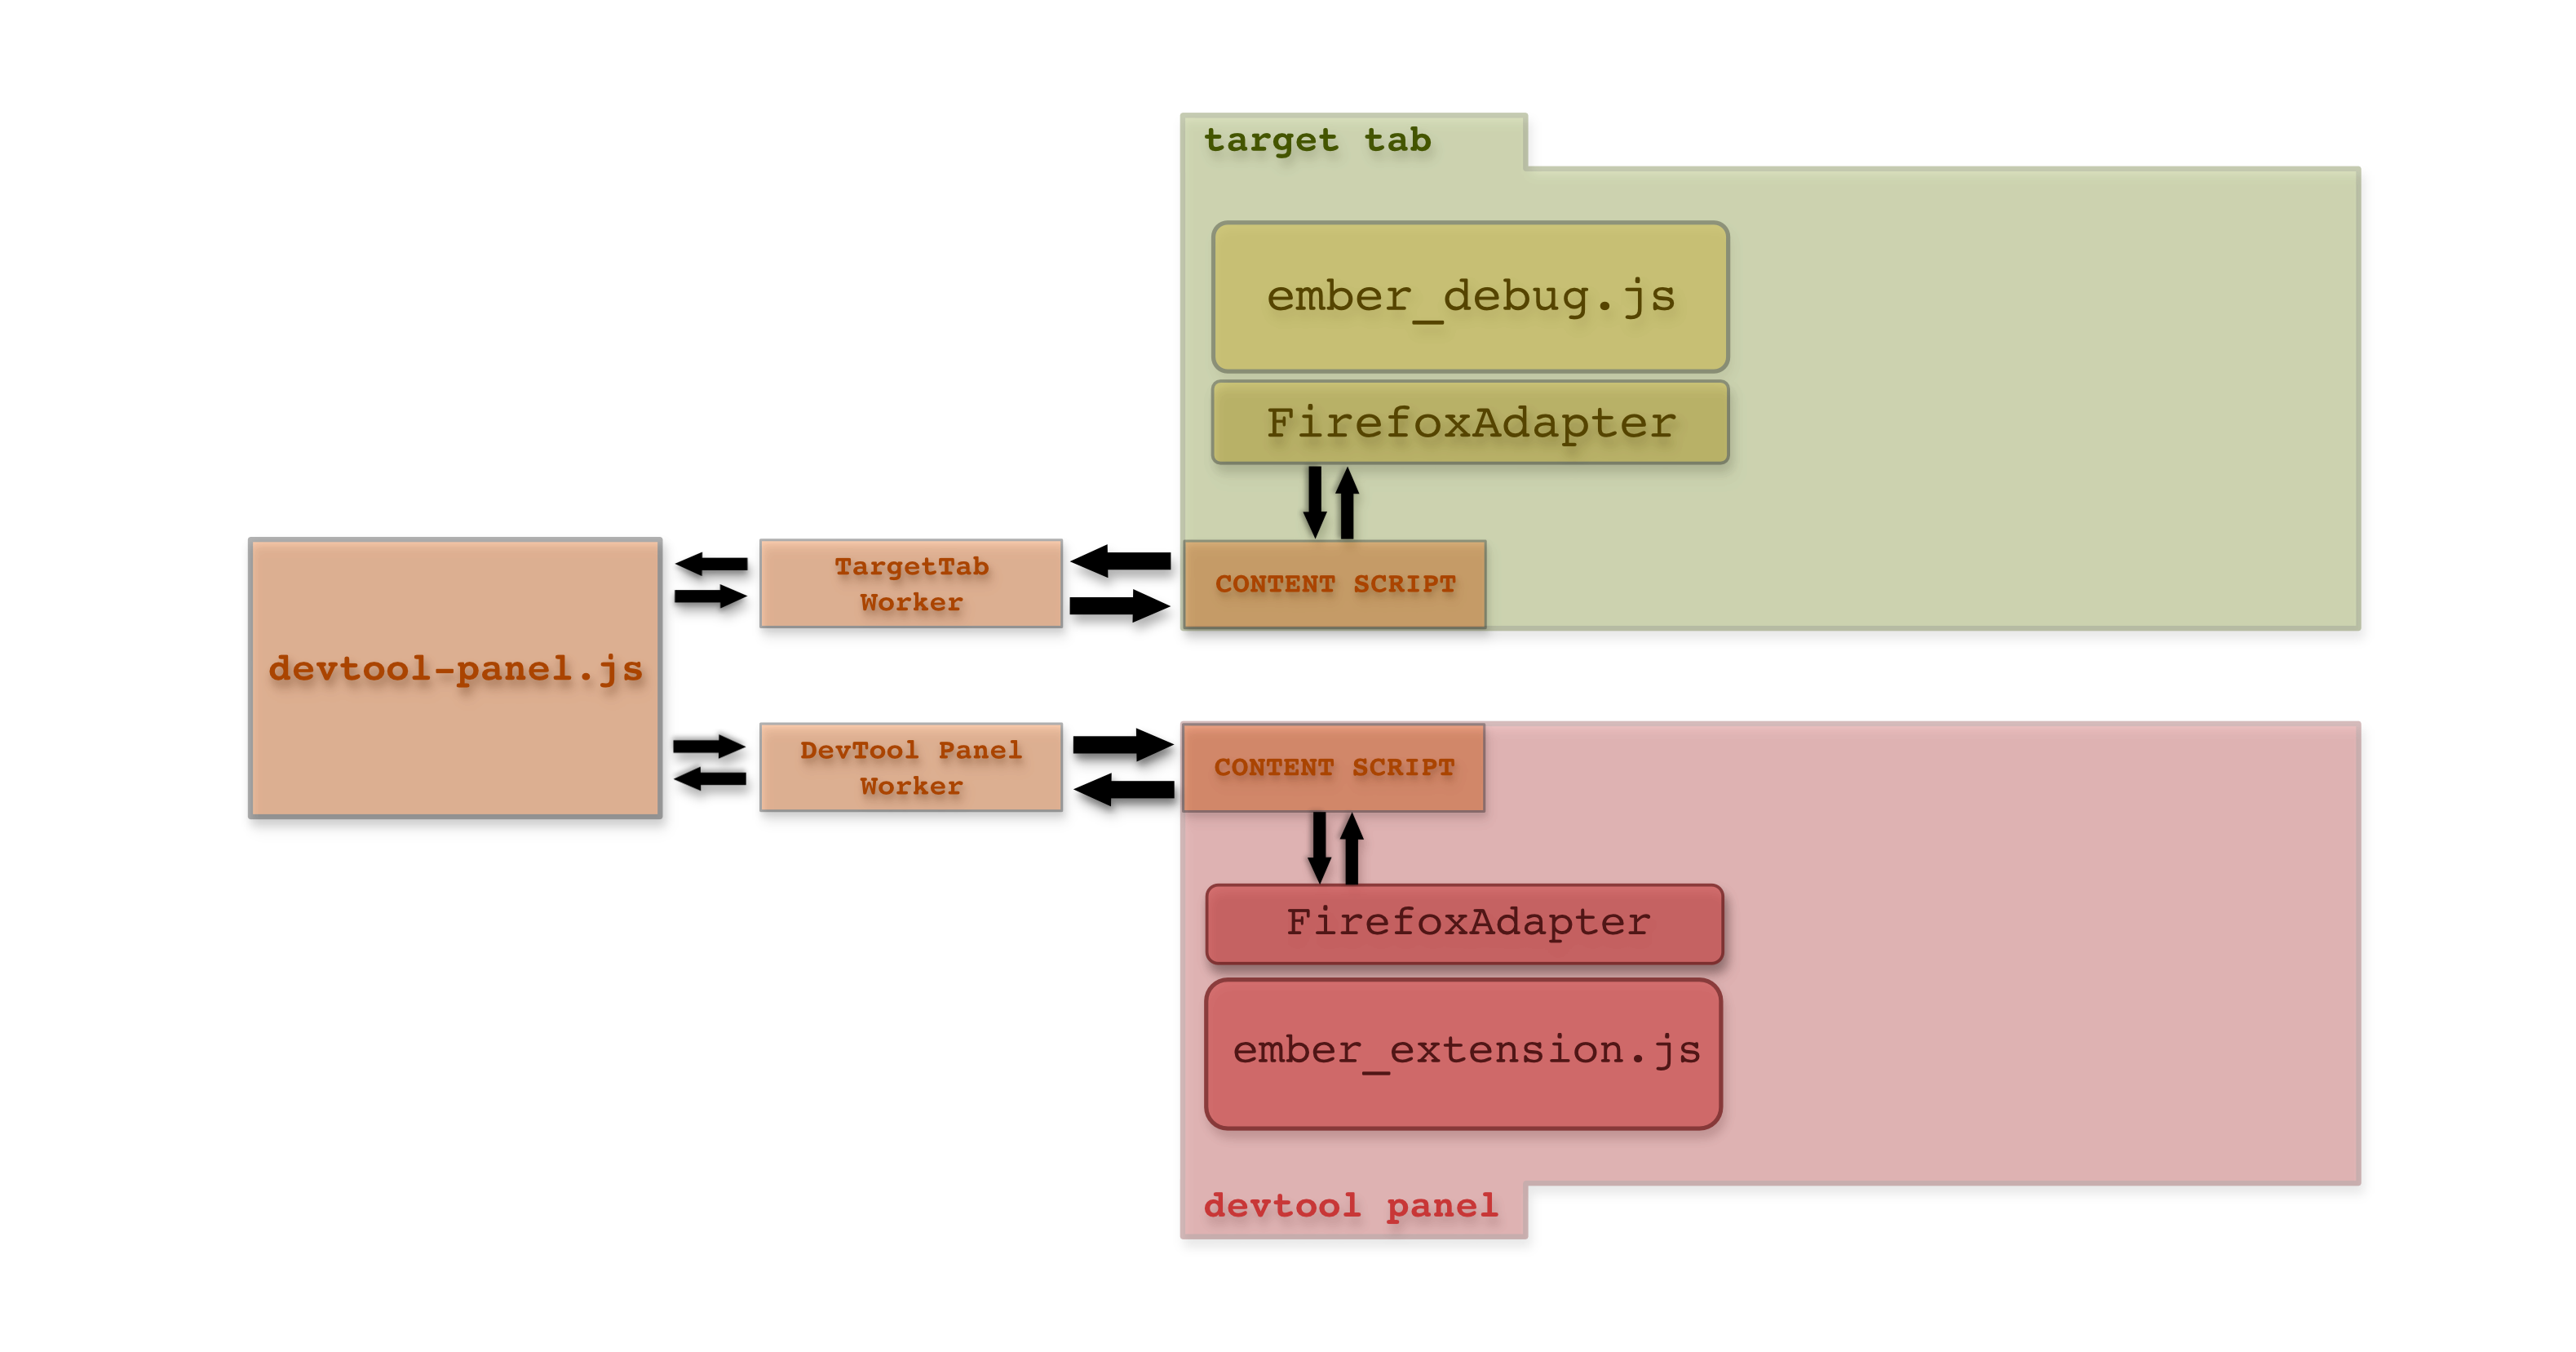
The extension communicates between the developer tools panel, the page and the main extension code via message passing:

Using this knowledge, planning the port to Firefox was surprisingly easy:
In my opinion this port was particularly pleasant to plan thanks to two main design choices:
Most of the JavaScript modules which compose this extension were already browser independent, so the first step was to bootstrap a simple Firefox Add-on and register a new devtool panel.
Create a new panel into the DevTools is really simple, and there’s some useful docs about the topic in the Tools/DevToolsAPI page (work in progress).
Register / unregister devtool panel
From https://github.com/tildeio/ember-extension/blob/master/dist_firefox/lib/main.js
Devtool panel definition
From https://github.com/tildeio/ember-extension/blob/master/dist_firefox/lib/devtool-panel.js#L26
Then, moving to the second step, adapt the code used to create the message channels between the devtool panel and injected code running in the target tab, using content scripts and the low level content worker from the Mozilla Add-on SDK, which are well documented on the official guide and API reference:
DevTool Panel Workers
From https://github.com/tildeio/ember-extension/blob/master/dist_firefox/lib/devtool-panel.js
Inject ember_debug
From https://github.com/tildeio/ember-extension/blob/master/dist_firefox/lib/devtool-panel.js
Finally hook browser specific code needed to activate the DOM Inspector on a defined DOM Element:
Inspect DOM element request handler
From https://github.com/tildeio/ember-extension/blob/master/dist_firefox/lib/devtool-panel.js#L178
Evaluate its features and dive into the exchanged messages
At this point one could wonder: how much useful is a tool like this?, Do I really need it? etc.
I must admit that I’ve started and completed this port without being an experienced EmberJS developer, but to be able to check if all the original features were working correctly on Firefox and to really understand how this browser add-on helps EmberJS developers during app development/debugging phases (its most important use cases), I’ve started to experiment with EmberJS and I have to say that EmberJS is a very pleasant framework to work with and Ember Inspector is a really important tool to put into our tool belts.
I’m pretty sure that every medium or large sized JavaScript framework need this kind of DevTool; clearly it will never be an integrated one, because it’s framework-specific and we will get used to this new family of DevTool Add-ons from now on.
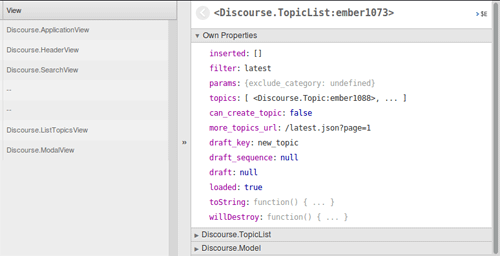
List Ember View, Model Components and Routes
The first use case is being able to immediately visualize Routes, Views/Components, Models and Controllers our EmberJS app instantiate for us, without too much webconsole acrobatics.
So its immediately available (and evident) when we open its panel on an EmberJS Apps active in the current browser tab:
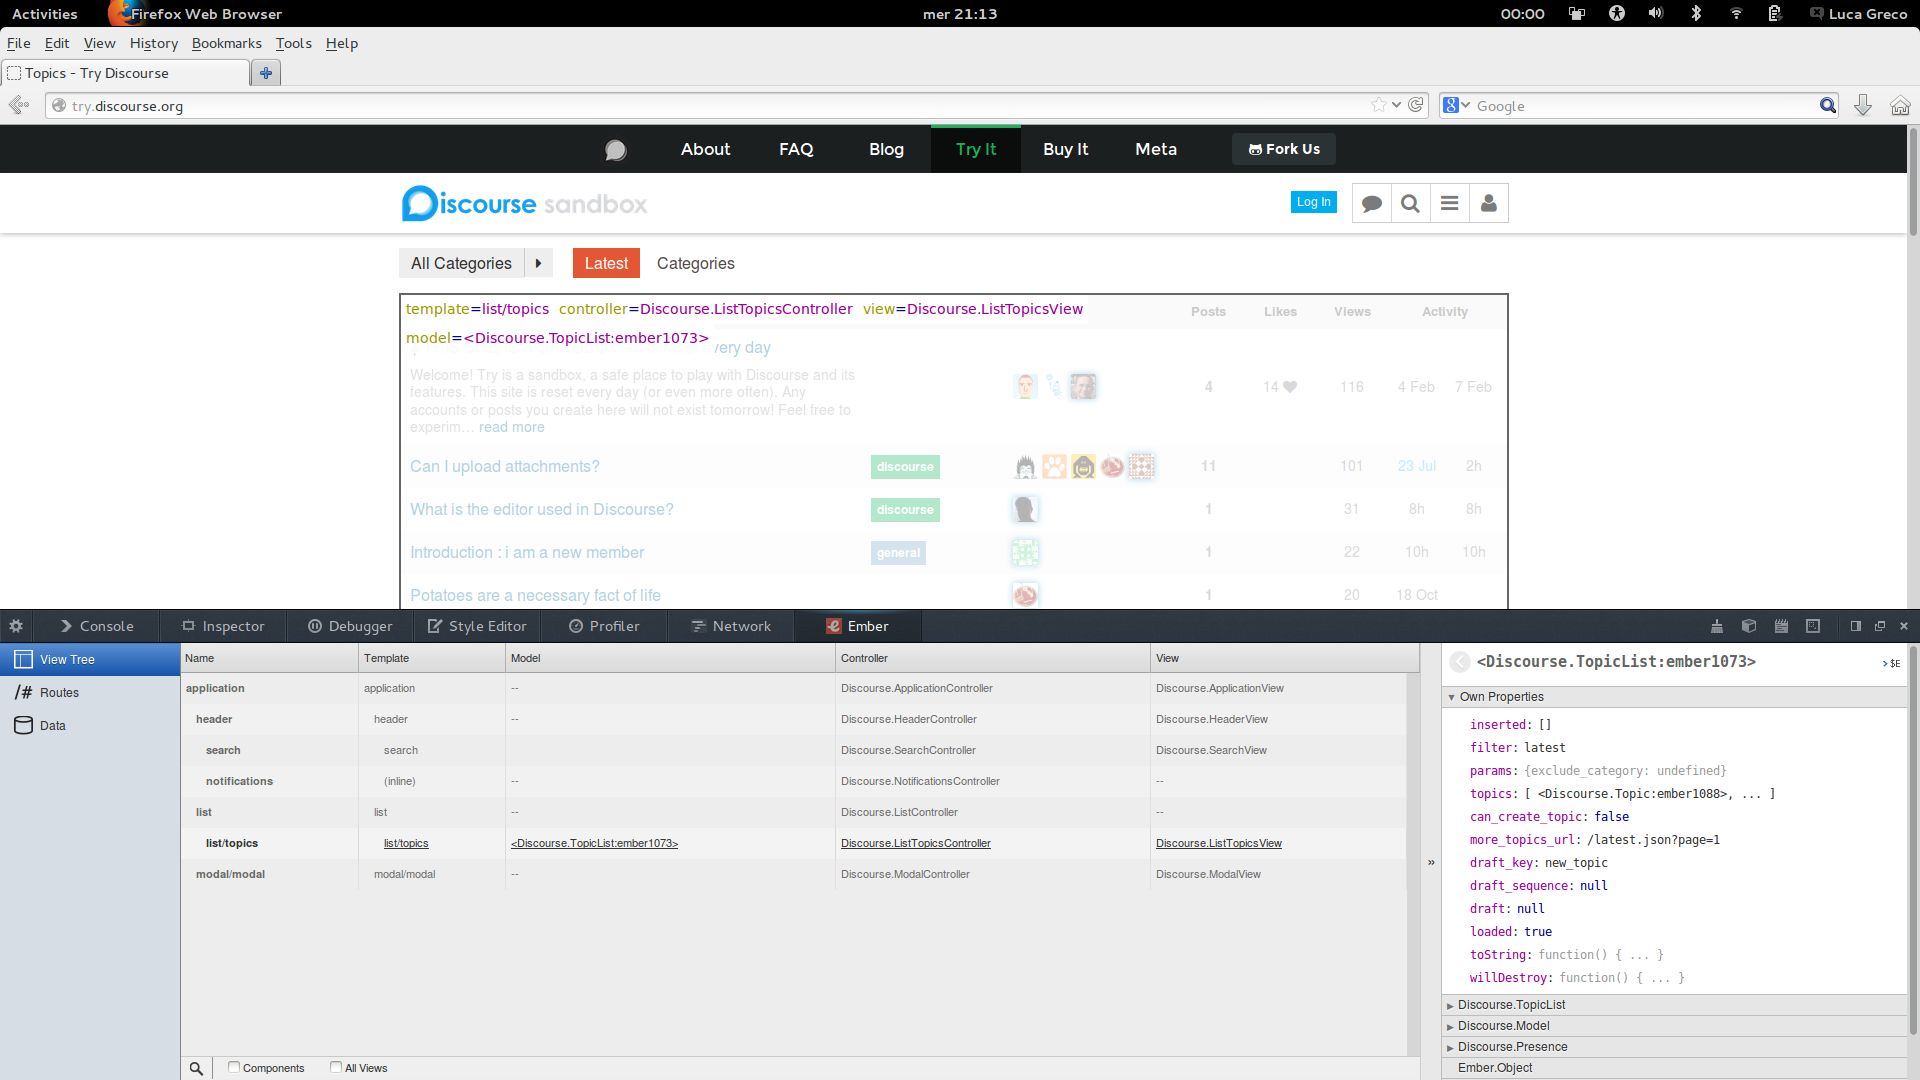
Using these tables we can then inspect all the properties (even computed ones) defined by us or inherited from the ember classes in the actual object hierarchy.
Using an approach very similar to the Mozilla Remote Debugging Protocol from the integrated DevTools infrastructure (e.g. even when we use devtools locally, they exchange JSON messages over a pipe), the ember_debug component injected into the target tab sends the info it needs about the instantiated EmberJS objects to the devtool panel component, each identified by internally generated reference IDs (similar to the grips concept from the Mozilla Remote Debugging Protocol.
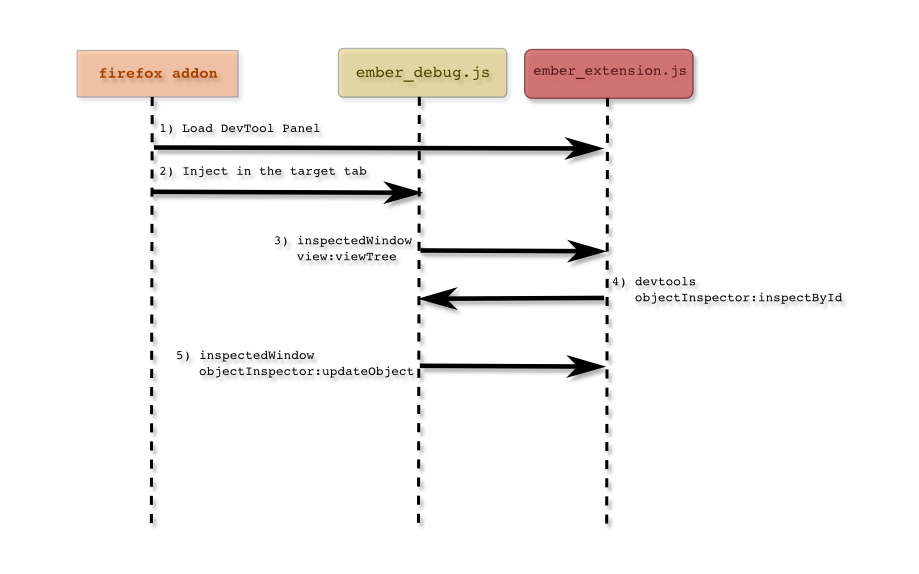
Logging the exchanged messages, we can learn more about the protocol.
Receive updates about EmberJS view tree info (EmberDebug -> DevtoolPanel):
Request inspect object (DevtoolPanel -> EmberDebug):
Receive updates about the requested Object info (DevtoolPanel -> EmberDebug):
Reach every EmberJS object in the hierarchy from the webconsole
A less evident but really useful feature is “sendToConsole”, to be able to reach any object/property that we can inspect from the webconsole, from the tables described above.
When we click the >$E link, which is accessible in the right split panel:
The ember devtool panel asks to ember_debug to put the defined object/property into a variable accessible globally in the target tab and named $E, then we can switch to the webconsole and interact with it freely:

Request send object to console (DevtoolPanel -> EmberDebug):
Much more
These are only some of the feature already present in the Ember Inspector and more features are coming in its upcoming versions (e.g. log and inspect Ember Promises).
If you already use EmberJS or if you are thinking about trying it, I suggest you to give Ember Inspector a try (on both Firefox or Chrome, if you prefer), it will turn inspecting your EmberJS webapp into a fast and easy task.
Integrate XPI building into the grunt-based build process
The last challenge in the road to a Firefox add-on fully integrated into the ember-extension build workflow was xpi building for an add-on based on the Mozilla Add-on SDK integrated into the grunt build process:
Chrome crx extensions are simply ZIP files, as are Firefox XPI add-ons, but Firefox add-ons based on the Mozilla Add-on SDK needs to be built using the cfx tool from the Add-on SDK package.
If we want more cross-browser add-ons, we have to help developers to build cross-browser extensions using the same approach used by ember-extension: a webapp built using grunt which will run into a browser add-on (which provides glue code specific to the various browsers supported).
So I decided to move the grunt plugin that I’ve put together to integrate Add-on SDK common and custom tasks (e.g. download a defined Add-on SDK release, build an XPI, run cfx with custom parameters) into a separate project (and npm package), because it could help to make this task simpler and less annoying.
Build and run Ember Inspector Firefox Add-on using grunt:
Following are some interesting fragments from grunt-mozilla-addon-sdk integration into ember-extension (which are briefly documented in the grunt-mozilla-addon-sdk repo README):
Integrate grunt plugin into npm dependencies: package.json
Define and use grunt shortcut tasks: Gruntfile.js
Configure grunt-mozilla-addon-sdk tasks options
Conclusion
Especially thanks to the help from the EmberJS/EmberInspector community and its maintainers, Ember Inspector Firefox add-on is officially merged and integrated in the automated build process, so now we can use it on Firefox and Chrome to inspect our EmberJS apps!
Stable:
Latest Build
In this article we’ve briefly dissected an interesting pattern to develop cross-browser devtools add-ons, and introduced a grunt plugin that simplifies integration of Add-on SDK tools into projects built using grunt: https://npmjs.org/package/grunt-mozilla-addon-sdk
Thanks to the same web first approach Mozilla is pushing in the Apps domain creating cross-browser add-ons is definitely simpler than what we thought, and we all win :-)
Happy Cross-Browser Extending,
Luca
About Luca Greco
About Robert Nyman [Editor emeritus]
Technical Evangelist & Editor of Mozilla Hacks. Gives talks & blogs about HTML5, JavaScript & the Open Web. Robert is a strong believer in HTML5 and the Open Web and has been working since 1999 with Front End development for the web - in Sweden and in New York City. He regularly also blogs at http://robertnyman.com and loves to travel and meet people.
2 comments