
The Browser Console
The Web Console was the first new developer tool added to Firefox 4, and the team has continued improving it in each release since. With Firefox 24 entering beta, we thought it would be a good time to highlight the features available in the Web Console and introduce its new cousin, the Browser Console.
The Browser Console replaces the venerable Error Console. To open it, hit the familiar Ctrl+Shift+J key-binding ( Command+Shift+J on OS X ):

- Toggle the different message types: Net, CSS, JS, Security and Logging.
- Select the level of severity of log messages you want to see for each type from the dropdowns.
- Hit the ‘Clear’ button to clear the log.
- Use the ‘Filter output’ box to narrow down the visible entries.
Note: if you’re feeling nostalgic for the old Error Console, you can change the devtools.errorconsole.enabled option to true from about:config.
What’s the difference then?
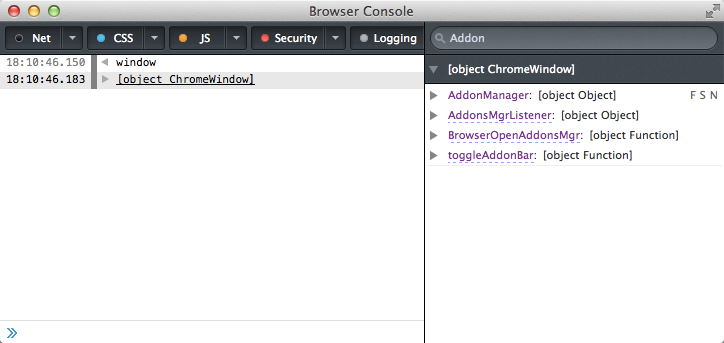
While the Web Console and Browser Console look the same, they operate in very different environments. The Web Console only interacts with the current Firefox tab content and is limited by the browser’s security model. The Browser Console will execute in the context of Firefox itself, with system-level privileges. As an illustration, the object we can inspect when we type ‘window’ in the Web Console is very different from the one returned by the Browser Console:
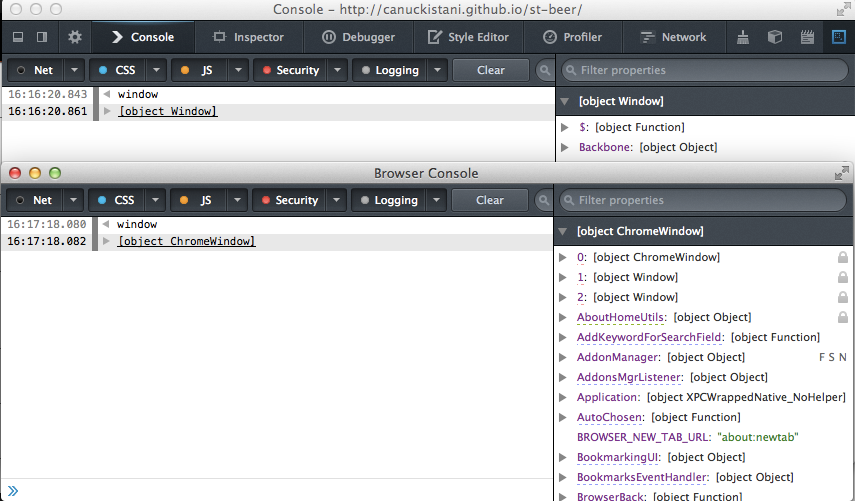
This browser-level scope will be particularly interesting to Firefox contributors and add-on developers looking for advanced logging & debugging features.
Add-on Access
If you are developing Firefox add-ons, you will definitely benefit from using the Browser Console for logging. Add-on developers can import the ‘Console.jsm’ module to print messages to the Browser Console:
let console = Cu.import("resource://gre/modules/devtools/Console.jsm").console;
console.log("hello", yourObject);
If you are using the Add-on SDK, the provided console object has already been switched to using the Browser Console’s new logging library as the back-end for the console object, so there is no need to change anything.
console.what?
Firebug ushered in the modern era of printf debugging for web pages by giving us the console object, and all browsers have since embraced this convenience api. Still, we often see developers posting to forums looking for ways to inspect complex JS Objects, often trading around helper functions like this:
function prettyPrint(o) {
return JSON.stringify(o, null, ' ');
}
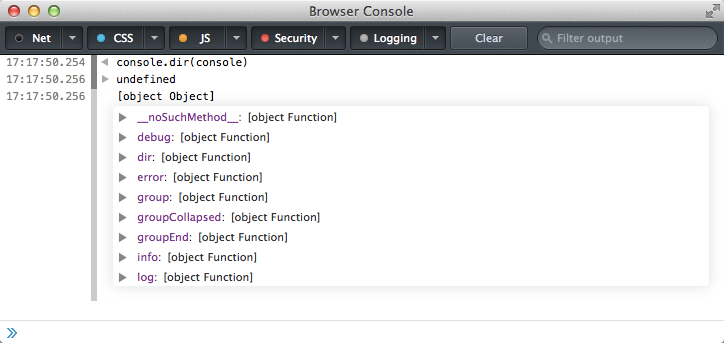
You don’t need to do this! The Firefox console object implements console.dir rather nicely, giving you an immediate and rather attractive expandable tree view of any object:
You can even do string substitution using the console apis using a printf-like syntax:
console.log('The number is %d, the string is "%s"', 42, 'Towel!');
Object Inspector
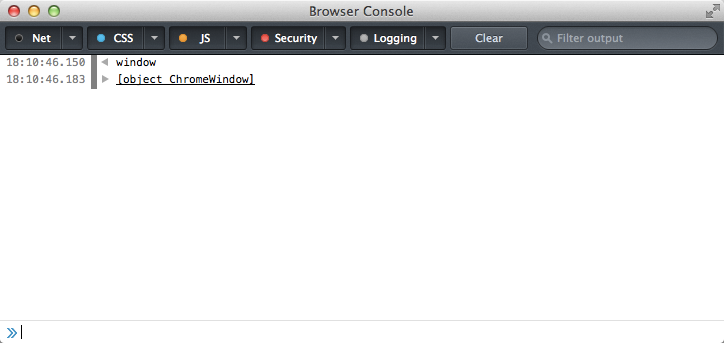
Log any object directly to the console, and you’ll see a click-able entry with the object’s type:
Click on the entry to show a tree view and a filter box:
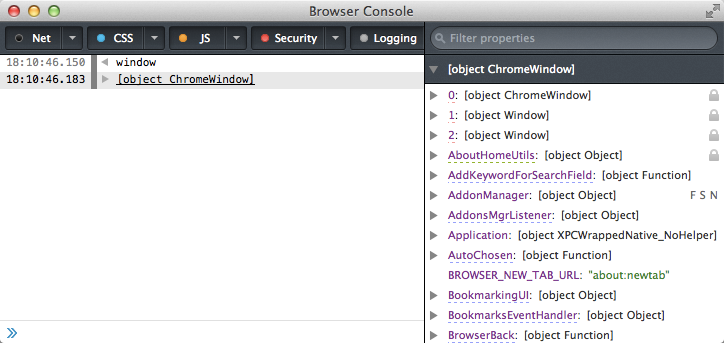
For large objects such as top-level Firefox ChromeWindow objects pictured it can be useful to filter properties:
Note: Bug 843019 is tracking an issue where filtering values does not work unless you first hit the escape key.
Console Helpers
The Web and Browser consoles implement a few helper functions that will make your life easier:
- $ and $$ are aliases for document.querySelector and document.querySelectorAll respectively.
- inspect(Object) opens the variable viewer side pane and shows a browseable tree view of that object.
- pprint(Object) dumps an object or array to the console as a string, which can come in really handy if you need to copy some data from a JS array out of the browser and into a text editor.
- clear() clears the current console, in case all the clutter is stressing you out. :)
And there’s more! The entire list is available on MDN.
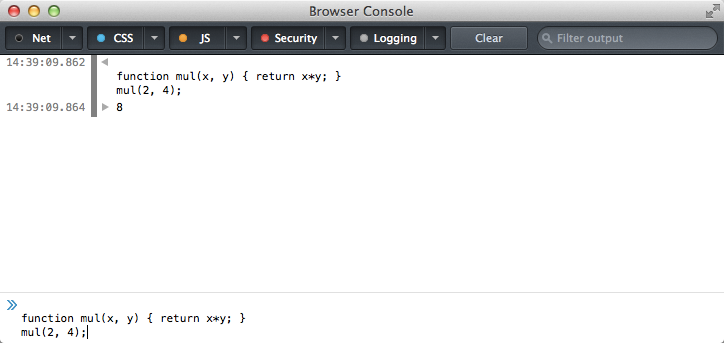
Multi-line Input
It is possible to evaluate more than a single line of Javascript. All you need to do is type Shift+Enter at the prompt to get started, and then Shift+Enter each time you need a newline:
If you need to input more than 2-3 lines, you should consider opening Scratchpad instead.
5 comments