Network Monitor, now in Firefox Beta

The Firefox Developer Tools team is particularly proud announce that Firefox 23 (in Firefox Beta, to be released today) ships with an initial but very functional Network Monitor tool that not only provides similar functionality to other tool sets, but in many improves on them. This important step is the result of lots of hard work from the entire team, but in particular Victor Porof and Mihai Sucan.

Let’s get started

To give you the best idea of how the network monitor works, here’s a series of steps to follow:

  1. Download, install and run Firefox 23 beta if you haven’t already (or Firefox Aurora or Firefox Nightly – more on Firefox and the release channels).
  2. Open the Network Monitor tool:
    • from the menu: Tools => Web Developer => Network
    • from the keyboard: Ctrl + Alt + Q (Windows/Linux) or Cmd + Alt + Q (Mac OS X)
  3. Load an interesting site.

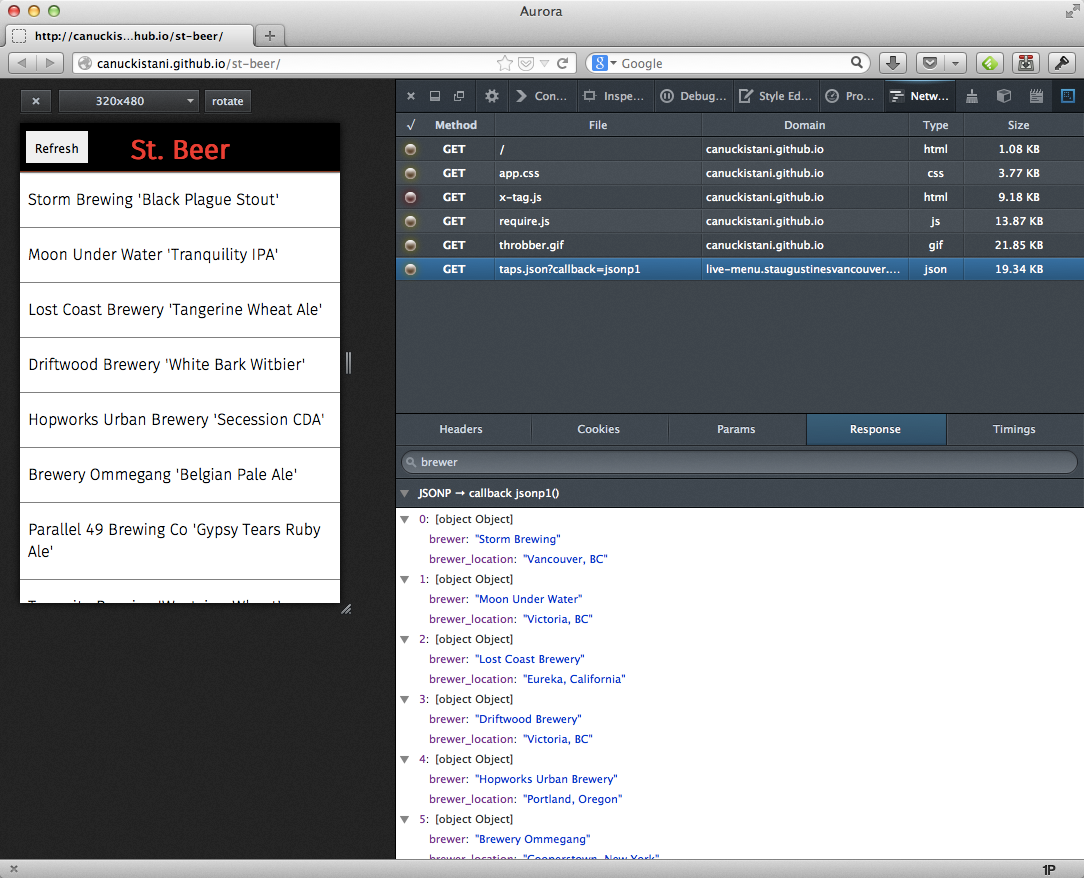
As Firefox loads the page you’ll see each individual request get added as a row, much as you would expect from other tools. In particular it is now very easy to visualize not just how quickly parts of the page load and in what order, but also where problems are: missing assets, slow web servers, buggy apis.

As you get used to using the Network Monitor, you’ll also notice that you don’t need to necessarily hit refresh on a page that is already loaded, once you open the network tool any subsequent requests that happen will be logged. For example, if you’re interested in xhr requests made by an app, just open the monitor and start clicking buttons – you should see any api calls logged as normal without needing to reload.

Status at a glance

One thing you should notice right away about the way the Network tool displays a page load is that we’ve taken care to provide both information and design cues to show you what is happening at a glance as the page loads:

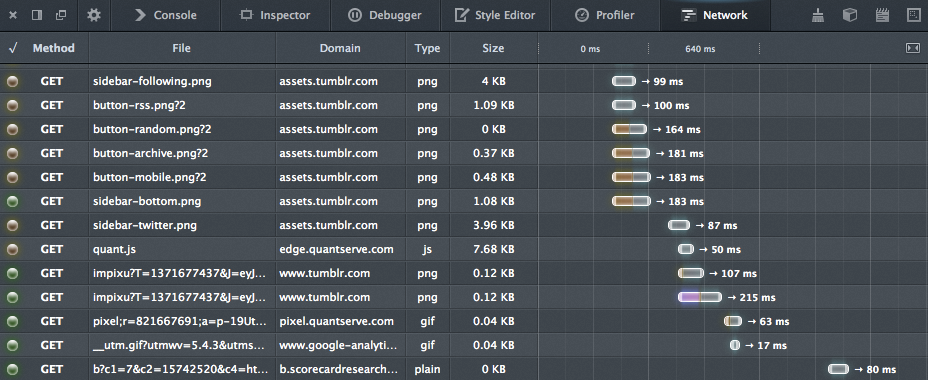
We’ve tried to create a clean UI that delivers key aspects of how an entire page loads without creating too much visual clutter:

  • An error such as a 404 are colored dark red to make them stand out visually from the green successful or yellow cached requests.
  • The url is parsed out and only the file name and domain are shown.
  • By default the load is sorted in chronological order, but you can also sort by any of the top columns, for example by domain or filename.
  • You can easily see the type of request, whether it be html content, an image or an API request.
  • You can click on the column headers to sort requests by method, file name, domain, type or size.

It’s all in the details

Once all the page’s assets have been loaded, clicking on a single request opens up the sidebar view which provides detailed information about that request, broken down into panels that display different aspects of a given request: Headers, Cookies, Parameters, Response and Timings. Similar to how the Inspector tool works, this panel is responsive and will neatly pop down below the request list if you’ve docked the tools to the right side:

A quick tour

The Headers panel is particularly useful for debugging asset caching problems, and this panel provides parsed lists for both the request and response headers that also supports filtering based on either name or value:

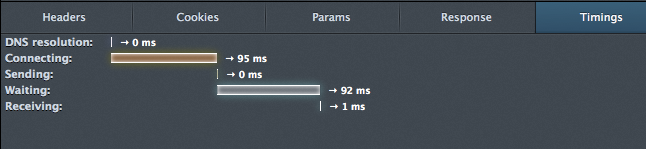
The Timings panel gives you a detailed, visual breakdown of where time was spent for the selected request. Is it DNS? Is it the server itself?

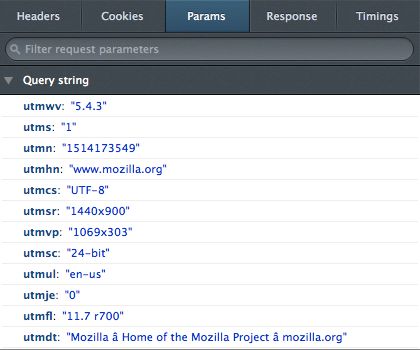
If you’re debugging API requests or form posts, you’ll really like how we’ve parsed out the url parameters in the Params panel:

Are you using a lot of API calls to improve the responsiveness of your app? JSON responses are parsed and displayed as a navigable object in the Response panel to make it easy to check on the data coming back from the server. You can filter the data based on JSON values as well.

Next Steps

It’s great to deliver the Network Monitor to a much wider set of developers in Firefox 23 Beta but we haven’t stopped adding new features in the meantime. Firefox 24 ( now in the Aurora channel ) features several notable improvements that have landed in the last 6 weeks or so:

  • You can now filter requests based on the request ‘type’, including XHR, images, html.
  • POST request parameters are supported in the Params panel.
  • You can browse the list of requests via the Up/Down arrow keys.
  • Many more bug fixes and refinements!

About Victor Porof

Mozillian, hacker, working on Firefox DevTools.

More articles by Victor Porof…

About Robert Nyman [Editor emeritus]

Technical Evangelist & Editor of Mozilla Hacks. Gives talks & blogs about HTML5, JavaScript & the Open Web. Robert is a strong believer in HTML5 and the Open Web and has been working since 1999 with Front End development for the web - in Sweden and in New York City. He regularly also blogs at http://robertnyman.com and loves to travel and meet people.

More articles by Robert Nyman [Editor emeritus]…


31 comments

  1. Omega X

    I wish they would fix the gaudy glowstick measuring sticks.

    June 27th, 2013 at 02:59

    1. Alber

      I disagree, i think it’s pretty cool :)

      June 27th, 2013 at 07:51

  2. Sam Chen

    In my case, firefox nightly on Ubuntu 12.04, the key to Open the Network Monitor tool is: Ctrl – Shift – Q.

    June 27th, 2013 at 03:28

    1. Robert Nyman [Editor]

      Ah, interesting. Thanks for sharing.

      June 27th, 2013 at 05:49

    2. Robson Sobral

      On Windows 8, too.

      June 27th, 2013 at 13:51

      1. Robert Nyman [Editor]

        Thanks. It could be that they’re trying different shortcuts in Nightly or that they plan on using that for something else.

        June 27th, 2013 at 14:26

  3. Bastian

    Thats fantastic feature, that i was missing in Firefox and what was a main adventage of Firebug.. Thanks a lot Mozilla!

    June 27th, 2013 at 04:36

    1. Robert Nyman [Editor]

      Thanks, glad ypu like it – we’re happy to be able to offer it now!

      June 27th, 2013 at 05:49

    2. pd

      What IS a main advantage of Firebug and has now been duplicated by Firefox. Coming up next, a rounder wheel.

      June 30th, 2013 at 11:28

  4. Debjit

    Actually, Mozilla is the proper web browser for Web Development, considering debugging tools, cache management and all other excellent features available on it.

    June 27th, 2013 at 05:41

    1. Robert Nyman [Editor]

      We’re glad you feel that way!

      June 27th, 2013 at 05:49

  5. Zetlen

    When collaboratively developing, it’s super important to be able to export debugging data out of your tools. One thing both Firebug and WebKit Inspector are missing is the ability to copy the “full session” of an HTTP request, i.e. the full raw request and response. You can do this in standalone HTTP monitors like Fiddler and Charles, but the best Web browsers can do is weird stuff like HAR. I would love to be able to copy individual network requests in common formats, including full session, from the context menu.

    June 27th, 2013 at 06:32

    1. Robert Nyman [Editor]

      Good input, thanks for the feedback!

      June 27th, 2013 at 14:04

  6. Peter

    Thanks for the update, much appreciated.

    Just a quick thought, Would it be possible to examine the Content Security Policy information being sent in the header with the original response and identify elements that do or do not fall within the approved list? I know its possible to report back to the server but this could be handy to have in the browser as we debug.

    Something to consider for a future feature addition to the Network information?

    thanks again for your work!

    June 27th, 2013 at 08:34

    1. Robert Nyman [Editor]

      It’s an interesting question, and if can find a good way to do it, I definitely feel it’s worth considering.

      June 27th, 2013 at 14:06

  7. Simon Charette

    Is there a way to clear entries?

    June 27th, 2013 at 13:06

    1. Robert Nyman [Editor]

      To my knowledge, only a reload clears them at this time. I assume the use of this would be to more easily see XHR requests after the page has loaded?

      June 27th, 2013 at 14:08

    2. Victor Porof

      Not yet, but it’ll happen soon. Follow this bug if you’re interested: https://bugzilla.mozilla.org/show_bug.cgi?id=859057

      June 28th, 2013 at 01:21

  8. Skoua

    Stupid and unrelated question but is there a way to set a keyboard shortcut for the Inspect function of dev tools?
    Firebug as Cmd + Shift + C on Mac but I can’t find one for the dev tools.

    And congrats for the Network Monitor, I’ve been using it since it landed on Nightly and it’s nice, its readability could be improve though, glows are useless.

    June 27th, 2013 at 15:54

    1. Robert Nyman [Editor]

      Currently, the shortcuts that are available are for specific tools, and are available under Tools > Web Developer.
      And thanks, glad you like the Network Monitor.

      June 28th, 2013 at 00:22

    2. kbrosnan

      ctrl / cmd + shift + i brings up the inspect console in inspect mode.

      July 3rd, 2013 at 10:57

  9. Alecs Galindo

    Just one think, thank you all Mozilla team, you are doing a great job, the last releases are so good, you are back to the right way, keep doing that.

    June 28th, 2013 at 23:06

    1. Robert Nyman [Editor]

      Thanks, happy to hear that!

      July 1st, 2013 at 03:02

  10. Vik Gamov

    Looks awesome but still not websocket monitoring in Dev Tools? How come?

    July 1st, 2013 at 22:19

    1. Robert Nyman [Editor]

      It’s being planned. Please see Nick’s comment on that.

      July 2nd, 2013 at 02:25

  11. Dane MacMillan

    I would like to see the HTTP status response per line. Currently this requires a click to see whether, for example, the page was 200 OK or 304 Not Modified. For devs who make use of browser caching, this is something useful to see at a glance.

    July 5th, 2013 at 20:02

    1. Victor Porof

      The green/yellow icons on the left represent status codes. Yellow is 3xx. Green is 2xx. Similarly, red is 4xx, pink is 1xx, blue is 5xx.

      July 6th, 2013 at 01:21

      1. Dane MacMillan

        I can see that, and hovering over an orb reveals the actual status code and reason, but it doesn’t help when you want to quickly glance at the responses from dozens of assets, particularly if you’re even just moderately colorblind; they’re indistinguishable to me. Hovering over or clicking on each line is not as efficient as having a clear overview of the responses. Moreover, lumping related responses together under similar colors only provides a way to approximate the type of response; hovering or clicking is still required to learn of the actual response, which is what’s useful.

        July 10th, 2013 at 12:21

        1. Victor Porof

          Thanks for the feedback. We’ll look into providing actual numbers for status codes instead of a metaphoric orb.

          July 10th, 2013 at 12:23

        2. Arthur Roussel

          I agree with you. Having a way to display the IP address assets came from would be nice too.

          July 10th, 2013 at 14:45

  12. Dennis Jakobsen

    The Network panel disrespects my authorotay on style choice!! I have the light theme, but Network panel is still in the dark!

    Otherwise great feature, thanks!

    July 12th, 2013 at 02:19

Comments are closed for this article.