Building A Node.JS Server That Won't Melt – A Node.JS Holiday Season, part 5

This is episode 5, out of a total 12, in the A Node.JS Holiday Season series from Mozilla’s Identity team. For this post, we bring the discussion back to scaling Node.JS applications.

How can you build a Node.JS application that keeps running, even under impossible load?

This post presents a technique and a library that implements that technique, all which is distilled into the following five lines of code:

var toobusy = require('toobusy');

app.use(function(req, res, next) {
  if (toobusy()) res.send(503, "I'm busy right now, sorry.");
  else next();
});

Why Bother?

If your application is important to people, then it’s worth spending a moment thinking about disaster scenarios. These are the good kind of disasters where your project becomes the apple of social media’s eye and you go from ten thousand users a day to a million. With a bit of preparation you can build a service that can persevere during traffic bursts that exceed capacity by orders of magnitude. If you forego this preparation, then your service will become completely unusable at precisely the wrong time – when everyone is watching.

Another great reason to think about legitimate bursts traffic, is malicious bursts of traffic: the first step to mitigating DoS attacks is building servers that don’t melt.

Your Server Under Load

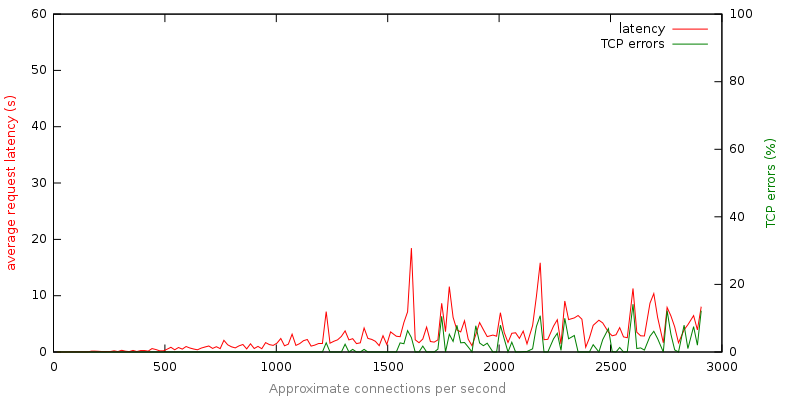
To illustrate how applications with no considerations for burst behave, I built an application server with an HTTP API that consumes 5ms of processor time spread over five asynchronous function calls. By design, a single instance of this server is capable of handling 200 requests per second.

This roughly approximates a typical request handler that perhaps does some logging, interacts with the database, renders a template, and streams out the result. What follows is a graph of server latency and TCP errors as we linearly increase connection attempts:

Analysis of the data from this run tells a clear story:

This server is not responsive: At 6x maximum capacity (1200 requests/second) the server is hobbled with 40 seconds of average request latency.

These failures suck: With over 80% TCP failures and high latency, users will see a confusing failure after up to a minute of waiting.

Failing Gracefully

Next, I instrumented the same application with the code from the beginning of this post. This code causes the server to detect when load exceeds capacity and preemptively refuse requests. The following graph depicts the performance of this version of the server as we linearly increase connections attempts:

Your server with limits

One thing not depicted on the graph is the volume of 503 (server too busy) responses returned during this run which steadily increases proportional to connection attempts. So what do we learn from this graph and the underlying data?

Preemptive limiting adds robustness: Under load that exceeds capacity by an order of magnitude the application continues to behave reasonably.

Success and Failure is fast: Average response time stays for the most part under 10 seconds.

These failures don’t suck: With preemptive limiting we effectively convert slow clumsy failures (TCP timeouts), into fast deliberate failures (immediate 503 responses).

To be clear, building a server that returns HTTP 503 responses (“server is too busy”), requires that your interface render a reasonable message to the user. Typically this is a pretty simple task, and should be familiar as it’s done by many popular sites.

How To Use It

node-toobusy is available on npm and github. After installation (npm install toobusy), simply require it:

var toobusy = require('toobusy');

At the moment the library is included, it will begin actively monitoring the process, and will determine when the process is “too busy”. You can then check if the process is toobusy at key points in your application:

// The absolute first piece of middle-ware we would register, to block requests
// before we spend any time on them.
app.use(function(req, res, next) {
  // check if we're toobusy() - note, this call is extremely fast, and returns
  // state that is cached at a fixed interval
  if (toobusy()) res.send(503, "I'm busy right now, sorry.");
  else next();
});

This application of node-toobusy gives you a basic level of robustness at load, which you can tune and customize to fit the design of your application.

How It Works

How do we reliably determine if a Node application is too busy?

This turns out to be more interesting that you might expect, especially when you consider that node-toobusy attempts to work for any node application out of the box. In order to understand the approach taken, let’s review some approaches that don’t work:

Looking at processor usage for the current process: We could use a number like that which you see in top – the percentage of time that the node process has been executing on the processor. Once we had a way of determining this, we could say usage above 90% is “too busy”. This approach fails when you have multiple processes on the machine that are consuming resources and there is not a full single processor available for your node application. In this scenario, your application would never register as “too busy” and would fail terribly – in the way explained above.

Combining system load with current usage: To resolve this issue we could retrieve current system load as well and consider that in our “too busy” determination. We could take the system load and consider the number of available processing cores, and then determine what percentage of a processor is available for our node app! Very quickly this approach becomes complex, requires system specific extensions, and fails to take into account things like process priority.

What we want is a simpler solution that Just Works. This solution should conclude that the node.js process is too busy when it is unable to serve requests in a timely fashion – a criteria that is meaningful regardless of the details of other processes running on the server.

The approach taken by node-toobusy is to measure event loop lag. Recall that Node.JS is at its core an event loop. Work to be done is enqueued, and on each loop iteration is processed. As a node.js process becomes over-loaded, the queue grows and there is more work to be done than can be done. The degree to which a node.js process is overloaded can be understood by determining how long it takes a tiny bit of work to get through the event queue. The node-toobusy library provides libuv with a callback that should be invoked every 500 milliseconds. Subtracting 500ms from the actual time elapsed between invocations gives us a simple measure of event loop lag.

In short, node-toobusy measures event loop lag to determine how busy the host process is, which is a simple and robust technique that works regardless of whatever else is running on the host machine.

Current State

node-toobusy is very new library that makes it easy to build servers that don’t melt by measuring event loop lag: attempting to solve the general problem of determining if a node.js application is too busy. All of the test servers described here as well as the load generation tools used in the post are available on github.

At Mozilla we’re currently evaluating applying this approach to the Persona service, and expect to refine it as we learn. I look forward to your feedback – as a comment on this post, on the identity mailing list, or in github issues.

Previous articles in the series

This was part five in a series with a total of 12 posts about Node.js. The previous ones are:


33 comments

  1. Simon

    Nice !

    It would be great to have the number of successful requests in the 2 cases.

    Does the server replies successfully to more requests with this “quick fail” method ? I guess not, but how does it compare ?

    January 15th, 2013 at 11:40

    1. Lloyd Hilaiel

      Great question. In fact, this is one possible weakness of the library as it’s currently implemented. Here’s a graph of successful responses in the two cases: http://cl.ly/image/3n0b252W3e2Z

      Note that when `toobusy` is enabled and traffic exceeds capacity, only about 70% of the volume of requests are successfully served as compared to when it’s off.

      I think a bit of tuning to the algorithm that determines when and how many requests to block could improve this: https://github.com/lloyd/node-toobusy/blob/master/toobusy.cc#L26-L31

      Feel free to open an issue to track this, and I have lots of thoughts I’d like to dump there. Thanks for your comment!

      January 16th, 2013 at 08:59

  2. Mark

    How do you track TCP errors in your node.js app?

    January 15th, 2013 at 13:35

    1. Lloyd Hilaiel

      For the purposes of these graphs, I tracked them in the load generation client: https://github.com/lloyd/node-toobusy/blob/master/examples/load.js#L55

      January 16th, 2013 at 09:01

  3. Randall A. Gordon

    The unification of software engineering and user experience. I love it! I’ll be keeping this in mind for future projects.

    January 15th, 2013 at 15:06

  4. Don Park

    FYI node.js’ setTimeout is just wrapper around uv_timer over default event loop.

    January 15th, 2013 at 18:46

    1. Lloyd Hilaiel

      That’s a valid observation – the implied question is: Does it really make any sense to implement this library in native code?

      When I migrated to native code for the implementation I was actually hoping to get around the fact that client code must call `.shutdown()` to have their node app shutdown gracefully. I have some ideas, but have not gotten there yet.

      Until this feature is implmented, my answer is, I’m not sure!

      Thanks for posting.

      January 16th, 2013 at 09:06

  5. bryant chou

    Great lib! We’ve been looking for something like this for awhile. in my jmeter testing it seems to do exactly what it says it does. Going to soft-roll it out onto an EC2 box that gets ~1000r/s to see what the magic number is.

    January 15th, 2013 at 19:10

    1. Lloyd Hilaiel

      Yo Bryant – Please report back / blog your findings. I’m curious to see how well this applies to a variety of different applications.

      (P.S. thanks for your code contributions! https://github.com/lloyd/node-toobusy/pull/5)

      January 16th, 2013 at 16:55

      1. bryant chou

        we have a CPU/memory intensive node webapp – which is why I think this approach to load control is spot on. Also, it’s a huge business fail safe since we could potentially DDOS ourselves if we don’t respond to API requests after a certain time (we have millions of phones accessing our various endpoints).

        So far so good, our webservers peak at 30ms lag during peak, and we’ve been keeping a keen eye on it. I’ve got some ideas about potentially tweaking the algo as well, will submit another pull if I feel like its worth the add!

        January 17th, 2013 at 17:13

        1. Lloyd Hilaiel

          bryant, funny enough I’ve initially found the sweet spot for persona to be 20ms. Our two “hot processes” peak at ~30ms.

          My initial guess here is that the artificial testing process that I built to pick a default parameter is not a very good representation of real world applications (too few trips through the event loop? too much simulated work?)

          January 31st, 2013 at 09:40

  6. Digital Planets

    Nice stuff, thinking you could also redirect the request to another server that hosts the app?

    January 15th, 2013 at 19:41

    1. Lloyd Hilaiel

      sure! a higher tier (proxy / routing) of your deployment could detect 503 responses and temporarily take the node out of rotation. or you could use the `.lag()` function in version 0.2.0 and have the node indicate somehow to the routing tier when it’s in trouble. Good idea, I think.

      January 16th, 2013 at 17:01

  7. Kevin

    I wonder how this will perform on Heroku. Any thoughts?

    January 16th, 2013 at 01:12

    1. Lloyd Hilaiel

      I don’t know, but I’m curious! Please share your findings?

      January 16th, 2013 at 09:08

  8. Kai

    What about a similar article for Dart?

    January 16th, 2013 at 06:45

  9. Charlie Hoover

    ….

    Is lag in the event loop really a determinate that server is being overloaded with requests? Could this not also be a consequence of writing blocking code/improper control flow?

    Very cool/interesting technique nonetheless

    January 16th, 2013 at 07:26

    1. Lloyd Hilaiel

      Great point. If you write a loop that runs for 50-100ms, then you will get false positives. I didn’t mention this caveat in the post.

      For applications that do this, I’d suggest a touch of reworking, maybe something along these lines? https://hacks.mozilla.org/2012/11/fully-loaded-node-a-node-js-holiday-season-part-2/

      January 16th, 2013 at 09:11

  10. Chris Saari

    @lloydhilaiel I like how AppEngine scales based on variance in response times vs. system load.

    January 16th, 2013 at 08:35

    1. Lloyd Hilaiel

      Hi old friend! So the assumption here is that there’s a tight correlation between event loop lag and slow response times. I’d guess that it just depends where in the stack you are which tactic you use?

      For AppEngine was the idea perhaps to implement load management transparent to the underlying application (in the proxy tier)?

      January 16th, 2013 at 16:54

  11. Scott Donnelly

    Nice work Lloyd, thanks – I will definitely use this.

    January 16th, 2013 at 14:16

  12. Eric

    Lloyd, this series you’re doing is fantastic — thank you for posting! Looking forward to the rest of the articles.

    And an offtopic idea — you might add Persona support to the comments on this blog? ;)

    January 16th, 2013 at 15:09

    1. Lloyd Hilaiel

      Eric, this is an incredibly good idea. I’m going to go rattle a cage or two ;)

      January 16th, 2013 at 16:40

  13. Mario Pareja

    Correct me if I’m wrong but doesn’t this only solve this problem for CPU bound systems. Were the system IO bound, the event loop would essentially be clear and toobusy would receive it’s expected callback as soon as the 500 ms is up.

    Am I missing something or perhaps is this not the case in practice where the IO operations finish at a quick enough rate to clog the event loop?

    In any case, those are implementation details, the API and idea is awesome!

    January 16th, 2013 at 16:05

    1. Lloyd Hilaiel

      You’re not wrong! If you wanted to return preemptive failures (HTTP 503) based on an overloaded, say, database, that is something that this library won’t help you with.

      January 16th, 2013 at 16:43

  14. Fizer Khan

    I am using multiple express app for modular architecture.
    Should I needed to add toobusy to all express application or adding to parent express app will be inherited by other express app?

    January 20th, 2013 at 07:12

    1. Lloyd Hilaiel

      In persona we have six distinct node processes. I’ve added toobusy to all of them – though in practice probably one or two are the bottlneck in times of extreme load?

      As you change your application configuration (add more of one class of node or add / change hardware), the hot process may shift, so having all components break gracefully is the route we’ve gone so far.

      January 31st, 2013 at 09:37

  15. Pete

    Thanks for your work! I’m afraid event loop delays might sometimes be caused by small hiccups due to other processes or gc sweeps, giving 503s accidentally even under moderate load? So perhaps it would be safe to allow a few seconds of ramp-up time until triggering.

    January 20th, 2013 at 14:33

    1. bryant chou

      We’ve observed this as well, a busy node app may report a lag above the watermark if there is a lot going on (BG GC operation for example). I’m thinking about adding a way to only return true in toobusy() if it has crossed the watermark X number of times, to prevent this exact case

      January 21st, 2013 at 16:38

      1. Lloyd Hilaiel

        this is not a bad idea, and roughly the motivation for dampening – https://github.com/lloyd/node-toobusy/blob/master/toobusy.cc#L18

        curious what max/min/avg numbers are for GC duration in your real world app?

        January 31st, 2013 at 09:34

  16. bryant chou

    ~80-100ms

    January 31st, 2013 at 19:51

  17. Matthew

    Lloyd, do you know if this plays nicely with the in-built cluster module? If you check toobusy() in a child process, will it report for just that process?

    March 8th, 2013 at 03:04

    1. Lloyd Hilaiel

      Yes! each process has distinct event loops, so toobusy() should behave well under the built in cluster module.

      March 11th, 2013 at 13:29

Comments are closed for this article.