an overview of TraceMonkey

This post was written by David Mandelin who works on Mozilla’s JavaScript team.

Firefox 3.5 has a new JavaScript engine, TraceMonkey, that runs many JavaScript programs 3-4x faster than Firefox 3, speeding up existing web apps and enabling new ones. This article gives a peek under the hood at the major parts of TraceMonkey and how they speed up JS. This will also explain what kinds of programs get the best speedup from TraceMonkey and what kinds of things you can do to get your program to run faster.

Why it’s hard to run JS fast: dynamic typing

High-level dynamic languages such as JavaScript and Python make programming more productive, but they have always been slow compared to statically typed languages like Java or C. A typical rule of thumb was that a JS program might be 10x slower than an equivalent Java program.

There are two main reasons JS and other dynamic scripting languages usually run slower than Java or C. The first reason is that in dynamic languages it is generally not possible to determine the types of values ahead of time. Because of this, the language must store all values in a generic format and process values using generic operations.

In Java, by contrast, the programmer declares types for variables and methods, so the compiler can determine the types of values ahead of time. The compiler can then generate code that uses specialized formats and operations that run much faster than generic operations. I will call these type-specialized operations.

The second main reason that dynamic languages run slower is that scripting languages are usually implemented with interpreters, while statically typed languages are compiled to native code. Interpreters are easier to create, but they incur extra runtime overhead for tracking their internal state. Languages like Java compile to machine language, which requires almost no state tracking overhead.

Let’s make this concrete with a picture. Here are the slowdowns in picture form for a simple numeric add operation: a + b, where a and b are integers. For now, ignore the rightmost bar and focus on the comparison of the Firefox 3 JavaScript interpreter vs. a Java JIT. Each column shows the steps that have to be done to complete the add operation in each programming language. Time goes downward, and the height of each box is proportional to the time it takes to finish the steps in the box.

time diagram of add operation

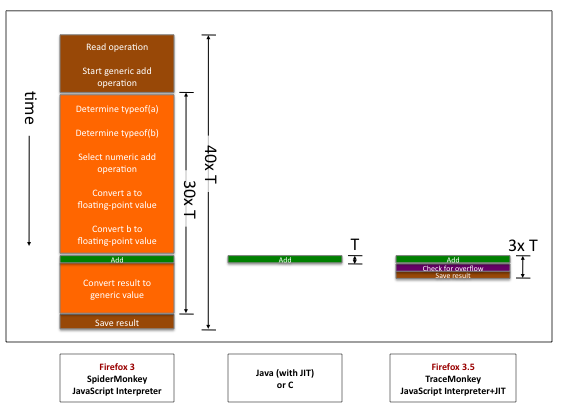
In the middle, Java simply runs one machine language add instruction, which runs in time T (one processor cycle). Because the Java compiler knows that the operands are standard machine integers, it can use a standard integer add machine language instruction. That’s it.

On the left, SpiderMonkey (the JS interpreter in FF3) takes about 40 times as long. The brown boxes are interpreter overhead: the interpreter must read the add operation and jump to the interpreter’s code for a generic add. The orange boxes represent extra work that has to be done because the interpreter doesn’t know the operand types. The interpreter has to unpack the generic representations of a and i, figure out their types, select the specific addition operation, convert the values to the right types, and at the end, convert the result back to a generic format.

The diagram shows that using an interpreter instead of a compiler is slowing things down a little bit, but not having type information is slowing things down a lot. If we want JS to run more than a little faster than in FF3, by Amdahl’s law, we need to do something about types.

Getting types by tracing

Our goal in TraceMonkey is to compile type-specialized code. To do that, TraceMonkey needs to know the types of variables. But JavaScript doesn’t have type declarations, and we also said that it’s practically impossible for a JS engine to figure out the types ahead of time. So if we want to just compile everything ahead of time, we’re stuck.

So let’s turn the problem around. If we let the program run for a bit in an interpreter, the engine can directly observe the types of values. Then, the engine can use those types to compile fast type-specialized code. Finally, the engine can start running the type-specialized code, and it will run much faster.

There are a few key details about this idea. First, when the program runs, even if there are many if statements and other branches, the program always goes only one way. So the engine doesn’t get to observe types for a whole method — the engine observes types through the paths, which we call traces, that the program actually takes. Thus, while standard compilers compile methods, TraceMonkey compiles traces. One side benefit of trace-at-a-time compilation is that function calls that happen on a trace are inlined, making traced function calls very fast.

Second, compiling type-specialized code takes time. If a piece of code is going to run only one or a few times, which is common with web code, it can easily take more time to compile and run the code than it would take to simply run the code in an interpreter. So it only pays to compile hot code (code that is executed many times). In TraceMonkey, we arrange this by tracing only loops. TraceMonkey initially runs everything in the interpreter, and starts recording traces through a loop once it gets hot (runs more than a few times).

Tracing only hot loops has an important consequence: code that runs only a few times won’t speed up in TraceMonkey. Note that this usually doesn’t matter in practice, because code that runs only a few times usually runs too fast to be noticeable. Another consequence is that paths through a loop that are not taken at all never need to be compiled, saving compile time.

Finally, above we said that TraceMonkey figures out the types of values by observing execution, but as we all know, past performance does not guarantee future results: the types might be different the next time the code is run, or the 500th next time. And if we try to run code that was compiled for numbers when the values are actually strings, very bad things will happen. So TraceMonkey must insert type checks into the compiled code. If a check doesn’t pass, TraceMonkey must leave the current trace and compile a new trace for the new types. This means that code with many branches or type changes tends to run a little slower in TraceMonkey, because it takes time to compile the extra traces and jump from one to another.

TraceMonkey in action

Now, we’ll show tracing in action by example on this sample program, which adds the first N whole numbers to a starting value:

 function addTo(a, n) {
   for (var i = 0; i < n; ++i)
     a = a + i;
   return a;
 }

 var t0 = new Date();
 var n = addTo(0, 10000000);
 print(n);
 print(new Date() - t0);

TraceMonkey always starts running the program in the interpreter. Every time the program starts a loop iteration, TraceMonkey briefly enters monitoring mode to increment a counter for that loop. In FF3.5, when the counter reaches 2, the loop is considered hot and it's time to trace.

Now TraceMonkey continues running in the interpreter but starts recording a trace as the code runs. The trace is simply the code that runs up to the end of the loop, along with the types used. The types are determined by looking at the actual values. In our example, the loop executes this sequence of JavaScript statements, which becomes our trace:

    a = a + i;    // a is an integer number (0 before, 1 after)
    ++i;          // i is an integer number (1 before, 2 after)
    if (!(i < n)) // n is an integer number (10000000)
      break;

That's what the trace looks like in a JavaScript-like notation. But TraceMonkey needs more information in order to compile the trace. The real trace looks more like this:

  trace_1_start:
    ++i;            // i is an integer number (0 before, 1 after)
    temp = a + i;   // a is an integer number (1 before, 2 after)
    if (lastOperationOverflowed())
      exit_trace(OVERFLOWED);
    a = temp;
    if (!(i < n))   // n is an integer number (10000000)
      exit_trace(BRANCHED);
    goto trace_1_start;

This trace represents a loop, and it should be compiled as a loop, so we express that directly using a goto. Also, integer addition can overflow, which requires special handling (for example, redoing with floating-point addition), which in turn requires exiting the trace. So the trace must include an overflow check. Finally, the trace exits in the same way if the loop condition is false. The exit codes tell TraceMonkey why the trace was exited, so that TraceMonkey can decide what to do next (such as whether to redo the add or exit the loop). Note that traces are recorded in a special internal format that is never exposed to the programmer — the notation used above is just for expository purposes.

After recording, the trace is ready to be compiled to type-specialized machine code. This compilation is performed by a tiny JIT compiler (named, appropriately enough, nanojit) and the results are stored in memory, ready to be executed by the CPU.

The next time the interpreter passes the loop header, TraceMonkey will start executing the compiled trace. The program now runs very fast.

On iteration 65537, the integer addition will overflow. (2147450880 + 65537 = 2147516417, which is greater than 2^31-1 = 2147483647, the largest signed 32-bit integer.) At this point, the trace exits with an OVERFLOWED code. Seeing this, TraceMonkey will return to interpreter mode and redo the addition. Because the interpreter does everything generically, the addition overflow is handled and everything works as normal. TraceMonkey will also start monitoring this exit point, and if the overflow exit point ever becomes hot, a new trace will be started from that point.

But in this particular program, what happens instead is that the program passes the loop header again. TraceMonkey knows it has a trace for this point, but TraceMonkey also knows it can't use that trace because that trace was for integer values, but a is now in a floating-point format. So TraceMonkey records a new trace:

  trace_2_start:
    ++i;            // i is an integer number
    a = a + i;      // a is a floating-point number
    if (!(i < n))   // n is an integer number (10000000)
      exit_trace(BRANCHED);
    goto trace_2_start;

TraceMonkey then compiles the new trace, and on the next loop iteration, starts executing it. In this way, TraceMonkey keeps the JavaScript running as machine code, even when types change. Eventually the trace will exit with a BRANCHED code. At this point, TraceMonkey will return to the interpreter, which takes over and finishes running the program.

Here are the run times for this program on my laptop (2.2GHz MacBook Pro):

System Run Time (ms)
SpiderMonkey (FF3) 990
TraceMonkey (FF3.5) 45
Java (using int) 25
Java (using double) 74
C (using int) 5
C (using double) 15

This program gets a huge 22x speedup from tracing and runs about as fast as Java! Functions that do simple arithmetic inside loops usually get big speedups from tracing. Many of the bit operation and math SunSpider benchmarks, such bitops-3bit-bits-in-byte, ctrypto-sha1, and math-spectral-norm get 6x-22x speedups.

Functions that use more complex operations, such as object manipulation, get a smaller speedup, usually 2-5x. This follows mathematically from Amdahl's law and the fact that complex operations take longer. Looking back at the time diagram, consider a more complex operation that takes time 30T for the green part. The orange and brown parts will still be about 30T together, so eliminating them gives a 2x speedup. The SunSpider benchmark string-fasta is an example of this kind of program: most of the time is taken by string operations that have a relatively long time for the green box.

Here is a version of our example program you can try in the browser:

Numerical result:

Run time:

Average run time:

Understanding and fixing performance problems

Our goal is to make TraceMonkey reliably fast enough that you can write your code in the way that best expresses your ideas, without worrying about performance. If TraceMonkey isn't speeding up your program, we hope you'll report it as a bug so we can improve the engine. That said, of course, you may need your program to run faster in today's FF3.5. In this section, we'll explain some tools and techniques for fixing performance of a program that doesn't get a good (2x or more) speedup with the tracing JIT enabled. (You can disable the jit by going to about:config and setting the pref javascript.options.jit.content to false.)

The first step is understanding the cause of the problem. The most common cause is a trace abort, which simply means that TraceMonkey was unable to finish recording a trace, and gave up. The usual result is that the loop containing the abort will run in the interpreter, so you won't get a speedup on that loop. Sometimes, one path through the loop is traced, but there is an abort on another path, which will cause TraceMonkey to switch back and forth between interpreting and running native code. This can leave you with a reduced speedup, no speedup, or even a slowdown: switching modes takes time, so rapid switching can lead to poor performance.

With a debug build of the browser or a JS shell (which I build myself - we don't publish these builds) you can tell TraceMonkey to print information about aborts by setting the TMFLAGS environment variable. I usually do it like this:

TMFLAGS=minimal,abort
dist/MinefieldDebug.app/Contents/MacOS/firefox

The minimal option prints out all the points where recording starts and where recording successfully finishes. This gives a basic idea of what the tracer is trying to do. The abort option prints out all the points where recording was aborted due to an unsupported construct. (Setting TMFLAGS=help will print the list of other TMFLAGS options and then exit.)

(Note also that TMFLAGS is the new way to print the debug information. If you are using a debug build of the FF3.5 release, the environment variable setting is TRACEMONKEY=abort.)

Here's an example program that doesn't get much of a speedup in TraceMonkey.

function runExample2() {
  var t0 = new Date;

  var sum = 0;
  for (var i = 0; i < 100000; ++i) {
    sum += i;
  }

  var prod = 1;
  for (var i = 1; i < 100000; ++i) {
    eval("prod *= i");
  }
  var dt = new Date - t0;
  document.getElementById(example2_time').innerHTML = dt + ' ms';
}

Run time:

If we set TMFLAGS=minimal,abort, we'll get this:

Recording starting from ab.js:5@23
recording completed at  ab.js:5@23 via closeLoop

Recording starting from ab.js:5@23
recording completed at  ab.js:5@23 via closeLoop

Recording starting from ab.js:10@63
Abort recording of tree ab.js:10@63 at ab.js:11@70: eval.

Recording starting from ab.js:10@63
Abort recording of tree ab.js:10@63 at ab.js:11@70: eval.

Recording starting from ab.js:10@63
Abort recording of tree ab.js:10@63 at ab.js:11@70: eval.

The first two pairs of lines show that the first loop, starting at line 5, traced fine. The following lines showed that TraceMonkey started tracing the loop on line 10, but failed each time because of an eval.

An important note about this debug output is that you will typically see some messages referring to inner trees growing, stabilizing, and so on. These really aren't problems: they usually just indicate a delay in finishing tracing a loop because of the way TraceMonkey links inner and outer loops. And in fact, if you look further down the output after such aborts, you will usually see that the loops eventually do trace.

Otherwise, aborts are mainly caused by JavaScript constructs that are not yet supported by tracing. The trace recording process is easier to implement for a basic operation like + than it is for an advanced feature like arguments. We didn't have time to do robust, secure tracing of every last JavaScript feature in time for the FF3.5 release, so some of the more advanced ones, like arguments, aren't traced in FF3.5.0. Other advanced features that are not traced include getters and setters, with, and eval. There is partial support for closures, depending on exactly how they are used. Refactoring to avoid these constructs can help performance.

Two particularly important JavaScript features that are not traced are:

  • Recursion. TraceMonkey doesn't see repetition that occurs through recursion as a loop, so it doesn't try to trace it. Refactoring to use explicit for or while loops will generally give better performance.
  • Getting or setting a DOM property. (DOM method calls are fine.) Avoiding these constructs is generally impossible, but refactoring the code to move DOM property access out of hot loops and performance-critical segments should help.

We are actively working on tracing all the features named above. For example, support for tracing arguments is already available in nightly builds.

Here is the slow example program refactored to avoid eval. Of course, I could have simply done the multiplication inline. Instead, I used a function created by eval because that's a more general way of refactoring an eval. Note that the eval still can't be traced, but it only runs once so it doesn't matter.

function runExample3() {
  var t0 = new Date;

  var sum = 0;
  for (var i = 0; i < 100000; ++i) {
    sum += i;
  }

  var prod = 1;
  var mul = eval("(function(i) { return prod * i; })");

  for (var i = 1; i < 100000; ++i) {
    prod = mul(i);
  }
  var dt = new Date - t0;
  document.getElementById('example3_time').innerHTML = dt + ' ms';
}

Run time:

There are a few more esoteric situations that can also hurt tracing performance. One of them is trace explosion, which happens when a loop has many paths through it. Consider a loop with 10 if statements in a row: the loop has 1024 paths, potentially causing 1024 traces to be recorded. That would use up too much memory, so TraceMonkey caps each loop at 32 traces. If the loop has fewer than 32 hot traces, it will perform well. But if each path occurs with equal frequency, then only 3% of the paths are traced, and performance will suffer.

This kind of problem is best analyzed with TraceVis, which creates visualizations of TraceMonkey performance. Currently, the build system only supports enabling TraceVis for shell builds, but the basic system can also run in the browser, and there is ongoing work to enable TraceVis in a convenient form in the browser.

The blog post on TraceVis is currently the most detailed explanation of what the diagrams mean and how to use them to diagnose performance problems. The post also contains a detailed analysis of a diagram that is helpful in understanding how TraceMonkey works in general.

Comparative JITerature

Here I will give a few comparisons to other JavaScript JIT designs. I'll focus more on hypothetical designs than competing engines, because I don't know details about them — I've read the release information and skimmed a few bits of code. Another big caveat is that real-world performance depends at least as much on engineering details as it does on engine architecture.

One design option could be a called a per-method non-specializing JIT. By this, I mean a JIT compiler that compiles a method at a time and generates generic code, just like what the interpreter does. Thus, the brown boxes from our diagrams are cut out. This kind of JIT doesn't need to take time to record and compile traces, but it also does not type-specialize, so the orange boxes remain. Such an engine can still be made pretty fast by carefully designing and optimizing the orange box code. But the orange box can't be completely eliminated in this design, so the maximum performance on numeric programs won't be as good as a type-specializing engine.

As far as I can tell, as of this writing Nitro and V8 are both lightweight non-specializing JITs. (I'm told that V8 does try to guess a few types by looking at the source code (such as guessing that a is an integer in a >> 2) in order to do a bit of type specialization.) It seem that TraceMonkey is generally faster on numeric benchmarks, as predicted above. But TraceMonkey suffers a bit on benchmarks that use more objects, because our object operations and memory management haven't been optimized as heavily.

A further development of the basic JIT is the per-method type-specializing JIT. This kind of a JIT tries to type-specialize a method based on the argument types the method is called with. Like TraceMonkey, this requires some runtime observation: the basic design checks the argument types each time a method is called, and if those types have not been seen before, compiles a new version of the method. Also like TraceMonkey, this design can heavily specialize code and remove both the brown and orange boxes.

I'm not aware that anyone has deployed a per-method type-specializing JIT for JavaScript, but I wouldn't be surprised if people are working on it.

The main disadvantage of a per-method type-specializing JIT compared to a tracing JIT is that the basic per-method JIT only directly observes the input types to a method. It must try to infer types for variables inside the method algorithmically, which is difficult for JavaScript, especially if the method reads object properties. Thus, I would expect that a per-method type-specializing JIT would have to use generic operations for some parts of the method. The main advantage of the per-method design is that the method needs to be compiled exactly once per set of input types, so it's not vulnerable to trace explosion. In turn, I think a per-method JIT would tend to be faster on methods that have many paths, and a tracing JIT would tend to be faster on highly type-specializable methods, especially if the method also reads a lot of values from properties.

Conclusion

By now, hopefully you have a good idea of what makes JavaScript engines fast, how TraceMonkey works, and how to analyze and fix some performance issues that may occur running JavaScript under TraceMonkey. Please report bugs if you run into any significant performance problems. Bug reports are also a good place for us to give additional tuning advice. Finally, we're trying to improve constantly, so check out nightly TraceMonkey builds if you're into the bleeding edge.


68 comments

  1. Gijs

    Excellent article! I have two questions after reading it (based in part on what I’ve heard here and there before 3.5 was released), the answers to which I hope may be useful to others, too:

    First, in Firefox 3.5, did tracing end up getting enabled for chrome (add-on/extension) code?

    Second, how do DOM and/or XPCOM (/XPConnect) calls affect tracing? Do they force using the interpreter, or could loops containing such calls be traced? Is there a straightforward way to improve performance of loops with such calls if they do not normally get traced? From what I can tell, using a mini-function as you did in the example with eval() would not help because the DOM/XPCOM/XPConnect calls would still not get traced (and thus have the code switch back to the interpreter mode), is that correct?

    July 17th, 2009 at 06:39

  2. baka_toroi

    Excelent post! Extremely detailed and understandable for people with little programming experience

    July 17th, 2009 at 06:56

  3. Klaus Paiva

    Amazing explanation! Very useful.

    July 17th, 2009 at 07:48

  4. […] An overview of TraceMonkey […]

    July 17th, 2009 at 08:35

  5. Sean Coates

    Curious: why is it that if I click the “Run Example 3” button repeatedly, the number climbs. (I got it all the way up the >250ms pretty quickly.)

    Doesn’t happen in Safari, and if I leave the button alone for a while (say 10s), it drops back to 2ms.

    July 17th, 2009 at 08:53

  6. Boris

    Gijs, the article actually covered that. DOM getters and setters force the interpreter. DOM method calls don’t (at least not the common ones).

    July 17th, 2009 at 09:27

  7. Gijs

    Boris: good call, I don’t know why I didn’t remember that when commenting. I would still like to know about XPCOM though! :-)

    July 17th, 2009 at 09:45

  8. Christopher Blizzard

    @Sean – we’re looking into that. It shouldn’t be happening and I’ve got a bug on file. Thanks for pointing it out! (Also if you keep clicking it eventually drops down to nothing – some kind of caching issue?)

    July 17th, 2009 at 09:47

  9. Boris

    Gijs: DOM stuff _is_ xpcom, no? Basically, any interface/method listed in js/src/xpconnect/src/dom_quickstubs.qsconf will be traced.

    July 17th, 2009 at 09:56

  10. Ian Stirling

    The differences with earlier versions are even more startling.

    For example (from memory)

    The first test – FF1.5 – 17000ms, FF3 – 2500ms, FF3.5.1 – 70ms

    A speedup of 300 times.

    July 17th, 2009 at 11:43

  11. William Edney

    David –

    What a great article and explanation! Thank you!

    You state:

    “But TraceMonkey suffers a bit on benchmarks that use more objects, because our object operations and memory management haven’t been optimized as heavily.”

    Are there plans in work to improve these operations in Tracemonkey?

    I work on code that uses many, many objects and I find both V8 and Nitro to be as much as 2X faster than Tracemonkey (FF 3.5 final version) on many parts of it.

    Just curious…

    Cheers,

    – Bill

    July 17th, 2009 at 12:59

  12. David Stokar

    @Boris: Correct – but doing remoting invalidates the effort of speeding up by factor two anyway.

    July 17th, 2009 at 13:12

  13. Boris

    Bill, there is work on that sort of thing, yes. If you are able to file a bug with your code attached, that’s the best way to ensure we investigate whatever our performance issue with that particular code is. Please cc “:bz” on the bug.

    July 17th, 2009 at 13:19

  14. Untraced Monkey

    After reading the comments, I tried repeatedly clicking in Example 3 and I noticed the same issue that Sean reported. The time increases slowly, and then suddenly jumps up to about 240ms. At the same time, Firefox’s memory uses suddenly increases, too (as displayed in the Windows Task Manager). When I keep clicking, the memory usage eventually drops back to around the old level and the execution times are back at around 2ms (it did not drop to nothing for me). Maybe this will help you locate the bug.

    July 17th, 2009 at 13:26

  15. Robert

    When running test 3, the first call returns a time of 1 ms. The second (or so) call returns 2 ms. Successive calls increase this to 10-15 ms, after which the time escalates to ~200-250ms. After a while (based on # of calls, not elapsed time), the execution time drops immediately to back to 2ms and the cycle repeats.

    Any insight into why the same call will take me 200x longer if I call it enough?

    July 17th, 2009 at 14:42

  16. Jeff Walden

    Regarding refactoring: keep in mind that as we improve TraceMonkey to trace more and more constructs, refactorings may become unnecessary over time, so it may not be worth the effort to carefully micro-optimize. Further keep in mind that JavaScript engines all optimize in different ways, and know that workarounds may affect different engines in different ways.

    Also on that note, object creation is one of the operations that is currently being sped up, in addition to the actions mentioned in the post itself.

    July 17th, 2009 at 15:27

  17. Ivan Enderlin

    Hey :-),

    Thank you for this fascinating article. Really great!

    I just noticed a typo. In the second paragraph after the diagram, you wrote: “The interpreter has to unpack the generic representations of a and i”. Maybe it’s “a and b”, isn’t?

    Thanks again :-).

    July 17th, 2009 at 15:46

  18. Ron

    Awesome post! I would love to see more under-the-hood articles like this and also status updates on TraceMonkey as it progresses.

    On a separate note, your Java times are way out of whack. Modern JVM’s execute with timings very close to C (and can actually be faster than C in certain cases due to dynamically profiling). There are a few gotchas when micro-benchmarking that can throw your times off. The two biggest are usually: 1) not executing the code enough times to let the dynamic profiler kick in, and 2) putting (all or part of) the micro-benchmark in main() because main never gets JIT’d and always runs interpreted. Also, running the -server JVM can result in big speed-ups as Java will do more aggressive optimizations.

    I ran the 3.0 and 3.5 tests to get a baseline of my computer’s performance relative to yours (mine is 40% slower :-P ), and then ran the same benchmarks in Java (using 1.6.0_14).

    Timings (1st number is my comp, 2nd number for the Java times are my predictions for your comp):
    SpiderMonkey (FF3): 1662
    TraceMonkey (FF3.5): 75
    Java (using int): 17, 10.2
    Java (using int) -server: 7, 4.2
    Java (using double): 36, 21.6
    Java (using double) -server: 25, 15

    As you can see, my predictions for server JVM times on your computer would be 4.2 and 15, right on top of the 5 and 15 you have for C.

    Here’s my code. To run the double test, just change runIntTest() to runDblTest() in main().

    public class Test {
    public static void main(String[] args) {
    for (int i = 0; i < 100; i++) {
    runIntTest();
    System.out.println();
    }
    }
    private static void runIntTest() {
    long t0 = System.currentTimeMillis();
    int n = addTo(0, 10000000);
    System.out.println(n);
    System.out.println(System.currentTimeMillis() – t0);
    }
    private static void runDblTest() {
    long t0 = System.currentTimeMillis();
    double n = addTo(0.0, 10000000);
    System.out.println(n);
    System.out.println(System.currentTimeMillis() – t0);
    }
    private static int addTo(int a, int n) {
    for (int i = 0; i < n; ++i) a = a + i;
    return a;
    }
    private static double addTo(double a, int n) {
    for (int i = 0; i < n; ++i) a = a + i;
    return a;
    }
    }

    July 17th, 2009 at 16:06

  19. a

    “Languages like Java compile to machine language, which requires almost no state tracking overhead.”

    Java is compiled to bytecodes which are then interpreted by a JVM. Although some of the hotspots are compiled to machine language for optimization, the rest is still interpreted. Please rectify that.

    July 17th, 2009 at 17:53

  20. Joao Pedrosa

    Good explanation. Thanks.

    The article and some of the informative comments above show that Mozilla is aware of the needs of users and the challenges that remain.

    I learned that to enable and disable JIT I do not need to restart the browser which was cool by itself. I disabled JIT because of the security warning I came across a couple of days ago. So enabling and disabling it made a huge difference in this case.

    I also did not know what the “tracing” part of it meant and this article shed some light into it.

    My Javascript code is generally good for enjoying the tracing capability as I have been using lots of “for loops” and trying to save on method calls. I also use some “switch” statements rather than “ifs” whether that helps or not. ;-) I worried a little bit when in rare situations using the same variable or method parameter to temporarily hold different kinds of data like when making the first parameter optional but still using the named parameters rather than the “arguments” facility. But those are rare (like less than 1% of methods I created).

    And I am on Linux and generally wait for the Ubuntu distro to ship new versions of Firefox so once the security fix arrives or something I will enable JIT again.

    As always, when trying to solve performance issues, good algorithms that save unnecessary computations are very important. So profile, see the bottleneck, try to optimize it, and expect the Mozilla guys will improve things in general for us on their end. :-)

    July 17th, 2009 at 22:29

  21. Luke

    @a – Modern JVMs, that is, the ones that perform respectably well on benchmarks, compile everything to machine code (albeit sometimes lazily), not just the hot spots.

    July 17th, 2009 at 23:44

  22. Dan Hirsch

    So, one very cool way that you can nearly reach the performance of non-specializing JITs is using polymorphic inline caches, where the first trace of a method uses a call to the most generic type, and as type information becomes known, calls to more specific functions are back-patched into the code. See http://research.sun.com/self/papers/pics.html for more details.

    July 18th, 2009 at 01:42

  23. […] quieres leer de una forma mejor explicada la forma de trabajo de este motor, nada como ir al artículo original. Comparte esta […]

    July 18th, 2009 at 05:17

  24. Boris

    David, I’m not sure what you mean by “doing remoting invalidates the effort of speeding up by factor two anyway”…

    Untraced Monkey, Robert, what’s going on in example 3 is fairly interesting. Every time you click the button, the second loop is run with a different value of mul. The compiled code assumes a particular value of mul and adds a check to ensure the actual value is the one it assumes. So on the second click, we get to the loop, start running the compiled code, discover that the actual value doesn’t match our expected one, exit to the interpreter and re-trace the loop with the new value. Now we have two traces for this loop.

    On the third click, we get to the call, check the value of mul against both of our existing traces, discover that neither one matches, exit to the interpreter, etc.

    Note that this means that each click will be a little slower, since each click has to do more work for the “check the value of mul against our existing traces” part. This gets you from 1-2ms to about 15ms, in my testing.

    As you probably noticed, we’re getting more and more traces here. Once we get to 32 traces, we stop generating new ones, as the article says. So after that point, on each iteration of the loop we call the compiled code, discover that mul doesn’t match any of our 32 traces, exit to the interpreter. Unlike the first 32 times, we no longer manager to create a new trace, so for each click we do the above call-into-compiled-then-fall-back 100000 times. This is what makes it so slow (about 4x slower than pure interpreter on my machine).

    https://bugzilla.mozilla.org/show_bug.cgi?id=504829 is the bug tracking this for those who want more details about how to debug this sort of thing and about what Brendan and David are thinking of in terms of solving it.

    July 18th, 2009 at 08:17

  25. Kailas Patil

    Good explanation! Very useful.

    July 19th, 2009 at 06:07

  26. Jan!

    Thanks for the informative article. I’m not much of an internals man, but you explained things pretty clearly.

    July 20th, 2009 at 05:37

  27. Ken

    “There are two main reasons JS and other dynamic scripting languages usually run slower than Java or C. The first reason is that in dynamic languages it is generally not possible to determine the types of values ahead of time. … The second main reason that dynamic languages run slower is that scripting languages are usually implemented with interpreters”

    I disagree. The number one reason why any program runs slow is because the programmer didn’t profile it. Scripting languages tend to have poor profilers (or no profiler at all). In the case of Javascript, I’ve only seen one profiler for it, and it sucks.

    If you write a bubblesort, even using C won’t help you. I don’t know anybody who would write bubblesort in Javascript, but I also don’t see any time/space usage notes in any JS documentation I’ve ever read. We could be writing code that’s exactly as stupid as bubblesort and never know it.

    (The cynic in me says: of course if you leave programmers alone they’ll put some hot 1980’s Smalltalk and Lisp technology in a browser. That’s easy. Making a usable profiler is hard work, for programmers, because it involves an actual user interface.)

    Still, I’m not complaining: it’s better to have Tracemonkey than to not have Tracemonkey! I just wish somebody would write a decent profiler. :’-(

    July 20th, 2009 at 12:07

  28. […] wrote an article on TraceMonkey on hacks.mozilla.org. It’s aimed at web developers and anyone else who wants to understand how TraceMonkey works […]

    July 20th, 2009 at 13:44

  29. Dave Mandelin

    Ron: Thanks for the info about Java. I thought that Java times were similar to C for microbenchmarks like this, so I was surprised by my results. You cleared that up. I was using the client VM. My test code is similar to yours, except that I run |runXTest| only once instead of 100 times. I tried using the server VM and the time for the double version went down from 75ms to 20ms, in line with your prediction. I assume that with more runs, you get to higher optimization levels and thus higher overall throughput. Also, it appears that the server VM has higher startup time, which may or may not matter on the web depending on how VMs are managed. Which settings are better for benchmarking is hard to say because it all depends on the workloads you really care about. We are doing some studies of Web code this summer to try to learn more about that.

    a: Yes, when I said that Java compiles to native code, I was speaking loosely. I think it’s fair to say that in modern high-performance JVMs, most runs of most performance-critical methods are run as native code. That level of detail wasn’t germane to the main things I wanted to talk about, so I simplified.

    Dan Hirsh: Thanks for the paper link. I’m aware of the PIC technique, and I expect (or at least hope) that we will start using it in TraceMonkey for certain things, but I hadn’t come across a good detailed technical presentation of PICs before.

    July 20th, 2009 at 14:24

  30. Alex Merk

    In the Google Chrome (with newest WebKit) working only first example. Two other have errors.

    July 20th, 2009 at 17:45

  31. Lindsey

    Great article. It’s vital that developers learn more about whats happening in this space – we’re all terribly excited by these enhancements in JS, but we’re not quite sure how to get the best out of it yet.

    One extra thing that I’d like to mention from my personal poking around: tracing is actually disabled when you profile JS (i.e. via firebug). So be careful using that as a way to get your timings.

    See http://code.google.com/p/fbug/issues/detail?id=1833 for the details.

    July 20th, 2009 at 17:46

  32. […] 原文地址:an overview of TraceMonkey 系列地址:颠覆网络35天 […]

    July 21st, 2009 at 02:24

  33. […] David Mandelin has generously detailed an overview of tracing and TraceMonkey in particular. […]

    July 21st, 2009 at 04:08

  34. […] David Mandelin has generously detailed an overview of tracing and TraceMonkey in particular. […]

    July 21st, 2009 at 07:10

  35. […] Mandelin who works on Mozilla’s JavaScript team recently published a great overview document about trace trees and TraceMonkey JS engine. This a must read article for those who use JavaScript heavily in there web applications and web […]

    July 21st, 2009 at 10:47

  36. […] Mandelin has generously detailed an overview of tracing and TraceMonkey in […]

    July 21st, 2009 at 13:41

  37. […] David Mandelin has generously detailed an overview of tracing and TraceMonkey in particular. […]

    July 21st, 2009 at 15:22

  38. Edward Rudd

    I believe one possible cause for the slowdown in example three when run multiple times is probably do to the creating of the function every time it’s run, and you are maybe hitting some garbage collection issues. I adusted the function separately and tested several variations.
    One using a var mul= function(i) {}; and dropping the eval (same effect of code). it still increased up to around 250-300ms.

    two moving the function/eval to the top of the method and having it take two params (avoiding the closure). same result.

    channging the code to prod = prod * i. that fixed it so it ran 1-2ms every time.

    Now this is odd.. I moved the mul function declaration outside of the function so it’s only created once, and takes two arguments. (prod and i). and called mul(prod,i) from within the example 3 fun. Now it consistently takes 250ms every time.

    July 22nd, 2009 at 08:23

  39. Edward Rudd

    here is some intersting investigation into example 3

    I adusted the function separately and tested several variations.

    One using a var mul= function(i) {}; and dropping the eval (same effect of code). it still increased up to around 250-300ms.

    two moving the function/eval to the top of the method and having it take two params (avoiding the closure). same result.

    channging the code to prod = prod * i. that fixed it so it ran 1-2ms every time.

    Now this is odd.. I moved the mul function declaration outside of the function so it’s only created once, and takes two arguments. (prod and i). and called mul(prod,i) from within the example 3 fun. Now it consistently takes 250ms every time.

    July 22nd, 2009 at 08:24

  40. […] link: an overview of TraceMonkey at hacks.mozilla.org […]

    July 22nd, 2009 at 21:54

  41. Boris

    Edward, can you post your code for the case that’s always slow?

    July 23rd, 2009 at 11:04

  42. […] http://hacks.mozilla.org/2009/07/tracemonkey-overview/ : des explications sur le fonctionnement de TraceMonkey, le moteur JS derrière Firefox 3.5 […]

    July 28th, 2009 at 09:09

  43. […] An overview of TraceMonkey, FireFox v3.5’s JavaScript engine. […]

    August 1st, 2009 at 20:42

  44. […] TraceMonkey JavaScript engine has continued to get […]

    August 7th, 2009 at 19:40

  45. […] The TraceMonkey JavaScript engine is being improved. […]

    August 9th, 2009 at 00:32

  46. […] the 3.6 features are faster JavaScript, the Web programming language Firefox executes with its TraceMonkey engine; faster page-rendering speed; some new features for CSS (Cascading Style Sheets) technology for […]

    August 9th, 2009 at 01:01

  47. […] the 3.6 features are faster JavaScript, the Web programming language Firefox executes with its TraceMonkey engine; faster page-rendering speed; some new features for CSS (Cascading Style Sheets) technology for […]

    August 9th, 2009 at 01:10

  48. […] the 3.6 features are faster JavaScript, the Web programming language Firefox executes with its TraceMonkey engine; faster page-rendering speed; some new features for CSS (Cascading Style Sheets) technology for […]

    August 9th, 2009 at 03:20

  49. […] the 3.6 features are faster JavaScript, the Web programming language Firefox executes with its TraceMonkey engine; faster page-rendering speed; some new features for CSS (Cascading Style Sheets) technology for […]

    August 9th, 2009 at 03:50

  50. […] Firefox 3.5 is even slower than Firefox 3.0 for this test. This is possibly because I haven’t optimized for Tracemonkey, but Firefox does not perform as well as expected. Regardless, the test is consistent with the […]

    August 10th, 2009 at 00:02

  51. Juan Lim

    This is great ! More power. Keep up the good work !

    August 10th, 2009 at 10:06

  52. […] de velocidad en el motor TraceMonkey , junto con algunos ajustes sobre Gecko […]

    August 12th, 2009 at 16:40

  53. […] 原文地址:an overview of TraceMonkey 系列地址:颠覆网络35天 […]

    August 19th, 2009 at 22:30

  54. […] function to drive improvements in key aspects of Mozilla products and technologies, including JavaScript performance, Canvas functionality, applications of Bespin, and others * to reach out to and increase […]

    September 10th, 2009 at 10:54

  55. anon_anon

    You may want to look at vtd-xml as the state of the art in XML processing, consuming far less memory than DOM

    vtd-xml

    November 27th, 2009 at 12:17

  56. przemelek

    Hi, nice article, but I have question, why for first test in FF 3.5.5 my laptop needs only about 43 ms [average], then on FF 3.6 beta 5 it takes 850 ms????
    Configuration of 3.5.5 looks identical like in 3.6, but 3.6 beta 5 is in this test 19 times slower.

    December 22nd, 2009 at 18:25

    1. Dave Mandelin

      Is it possible tracing is turned off in your 3.6 configuration? I just tried it in a 3.6 nightly and I found that the first test was slow if I set javascript.options.jit.content to false in about:config, but if it is set to true (the default for new profiles), then it runs in about 45ms, same as 3.5.

      January 6th, 2010 at 18:51

  57. […] Javascript的JIT后端,原先firefox直接使用javascript解释器,效率比较低。nanojit可以将频繁执行的javascript代码直接翻译为机器码执行,效率更高,性能更好。详细的介绍可以参看这篇文章:an overview of TraceMonkey,  (我是中国人,我要看中文 ) […]

    December 23rd, 2009 at 19:44

  58. […] also the hacks article for much more background on how tracing […]

    February 26th, 2010 at 15:40

  59. CAFxX

    I was wondering if LLVM has ever been considered as a replacement for the JIT, obviously implementing tracing on top of it.

    February 26th, 2010 at 23:24

  60. […] Mozilla’s engine is fundamentally different than every other engine: everyone else uses what’s called a “method-based JIT”. That is, they take all incoming JS code, compile it to machine code and then execute it. Firefox uses a “tracing JIT.” We interpret all incoming JS code and record as we’re interpreting it. When we detect a hot path, we turn that into machine code and then execute that inner part. (For more background on tracing, see this post on hacks from last year.) […]

    March 1st, 2010 at 11:42

  61. Dave Mandelin

    @CAFxX

    LLVM has been talked about, but apparently we’re not ready to try it yet. I think the biggest concern is code size. It also does more optimizations than we need right now, and presumably would take correspondingly longer to compile things (although I really don’t know, and I think you can turn optimizations off). It seems that for now we can do what we need to with simpler systems, so that’s what we’ve been doing. We should definitely keep LLVM in mind, though.

    March 1st, 2010 at 14:23

  62. Jeff Walden

    CAFxX, it’s also worth considering the outcome of the unladen-swallow project. For what we’ve been doing, LLVM may not necessarily be the best choice.

    March 1st, 2010 at 14:56

  63. […] code. Many JavaScript programs ran 3-4x faster in TraceMonkey compared to Firefox 3. (See our previous article for technical […]

    March 10th, 2010 at 09:52

  64. […] 기계어로 변환하고 내부적으로 실행 합니다. (Tracing 대한 자세한 내용은 지난해 hacks의 포스트를 […]

    August 12th, 2010 at 17:32

  65. Delarke

    very much interesant, good search – I have learned some good points from this post.

    January 14th, 2011 at 10:20

  66. MIZ-Networx

    Great artikel, incredible speedup with jit

    March 2nd, 2011 at 13:19

  67. […] code. Many JavaScript programs ran 3-4x faster in TraceMonkey compared to Firefox 3. (See our previous article for technical […]

    March 3rd, 2012 at 09:47

Comments are closed for this article.