On blog.mozilla.org, we shared results of a speed comparison study to show how fast Firefox Quantum with Tracking Protection enabled is compared to other browsers. While the blog post there focuses on the results and the speed benefits that Tracking Protection can deliver to users even outside of Private Browsing, we also wanted to share some insights into the methodology behind these page load time comparison studies and benchmarks for different browsers.
A general approach to comparing performance across browsers
The most important part to consider when comparing performance across browsers is to select metrics that are comparable between them. Most commonly, these metrics come from standardized Web APIs. Regarding performance comparisons, the Navigation Timing API offers a great source of data that is available across browsers. In particular, its PerformanceTiming interface offers access to properties that provide performance data for various events that occur during page load.
For completeness, we want to mention that there are also visual inspection metrics that focus on screen captures. Metrics of interest here include timings from the start of the page request, e.g. mouse click or key press, to specific points in time: First Paint or visual metrics like SpeedIndex, Perceptual Speed Index, or Visual Complete, the moment when no more changes happen above the fold.
For this blog post, we will focus on comparisons based on the Navigation Timing API.
Selecting a test set and designing your test
In addition to a well-defined set of test metrics, it’s also necessary to select meaningful test content. Benchmarks and comparisons that focus on technical aspects may select a set of challenging websites. In our tests, we focus on the user and hence look for a selection of websites that matter to our users. Often, a set of popular websites is a good approach, although sometimes it makes sense to focus on specific categories as well. Alexa, for example, offers sets of top sites in different categories and countries.
In our study, we focused on the global top 200 news websites, selected because these tend to have the most trackers. The websites were loaded in Chrome v61.0.3163.100 in normal and Incognito mode and in Firefox Quantum Beta v57.0b10 in normal and Private Browsing mode with Tracking Protection enabled. Per browser, each website was loaded 10 times.
With metrics and a set of test websites chosen, you can start running your test.
Controlling your experiment with Selenium WebDriver
Everybody who has run some benchmarks and performance comparisons may agree with me that running the tests and collecting the data can be tiresome. Therefore, it makes sense to automate your testing when possible. Again, it’s important to choose an automation method that works across browsers. This can either be done through an external scripting application like Mozilla’s Hasal project or through a browser automation framework like Selenium WebDriver which is a remote control interface to control user agents.
Our page load test was based on a Python script that used the Selenium Python bindings to control the browsers through geckodriver and chromedriver, respectively. A functional, but not yet perfect, script similar to the one that loads a set of websites in both Chrome and Firefox and stores window.performance.timing after each load can be found here. I am looking forward to patches for improvements.
We performed our tests on a recent Macbook Pro (13” Macbook Pro 2017, 3.1GHz i5, 16GB memory, OSX 10.13) that was connected to a Webpass 100Mbps connection over WiFi (802.11ac, 867Mbit/s). The script loaded a website in one of the browsers and saved the performance load times with return window.performance.timing as a csv file. Each website was loaded 10 times per browser. In the script, a page load timeout was set to 60 seconds. Especially with ads on websites, pages can load extremely slowly. In this case, the page load was interrupted after 60 seconds by the script. It used the PerformanceTimingAPI to check if loadEventEnd was already present.
loadEventEnd represents the moment when the load event for the requested page is completed, i.e all static content of the page is fully loaded. If there was a loadEventEnd time saved, it was then stored in a csv file. If not, the script tried to load the respective page anew. In the few cases when the repeated page request also timed out, the page was loaded manually without any automated timeout set and the window.performance.timing was requested manually after the page was fully loaded.
A look at results
The raw data for our study can be found here. For reference, the analysis in R is available as RMarkdown notebook, too.
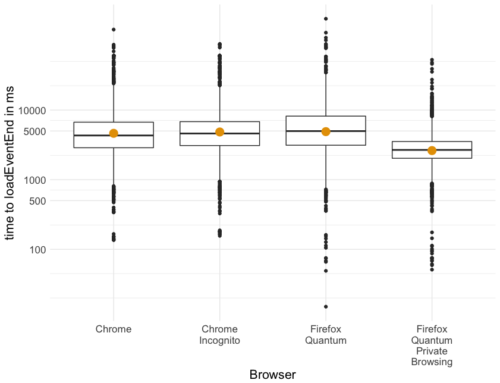
First, let’s compare browsers’ mean page load times. For this, we look at the mean page load time per browser by averaging across all 2000 measurement (200 news websites * 10 runs per page) per browser. The means per browser are plotted as orange points below. In addition, and to better understand the spread in the data, boxplots per browser are also shown.
The load time difference between Chrome’s Incognito mode and Firefox Quantum Private Browsing is 2.4x. We see no difference between Chrome’s normal and Incognito mode. This shows that the differences between Firefox Quantum and its Private Browser option, which is similar to Chrome’s Incognito mode + Tracking Protection, must come from Tracking Protection.
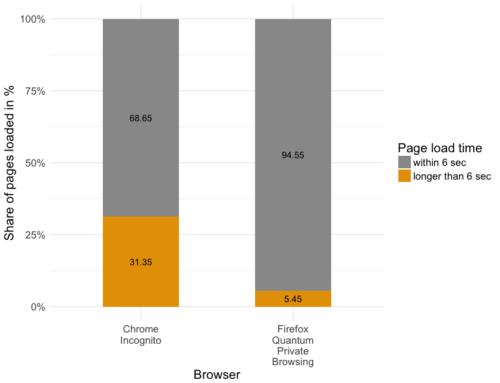
It is a valid concern that loadEventEnd may not be the best indicator for what users experience on screen when loading a page. However, both loadEventEnd as well as average session load time were recently found to be good predictors for user bounce rate. From the results of the third-party study by SOASTA Inc., we find that an average session load time of 6 seconds leads to a 70% bounce rate. Let’s look at the share of pages in our data that has a load time longer than 6 seconds and compare across browsers. While only about 5.5% of page loads take longer than 6 seconds for Firefox Quantum with Tracking Protection, it’s about 31% of all pages for Google Chrome.
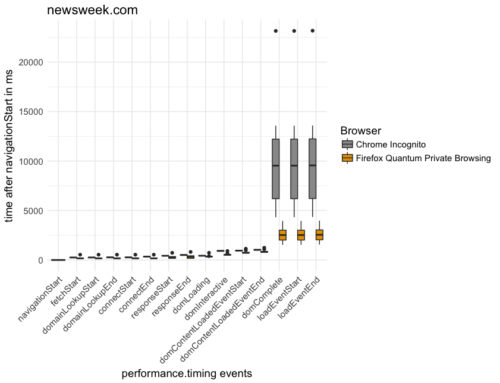
One last question of interest is if the data can also be used to understand where the differences between browsers occur during page load. Let’s only look at Chrome Incognito and Firefox Quantum Private Browsing again. performance.timing gives events over the course of the page load process. We can print these events in order of appearance during page load and look at differences between browsers, using newsweek.com as an example.
It becomes evident that the main differences occur towards the end of loading process. The work required to create the DOM is similarly fast in both browsers, but Chrome waits for content significantly longer than Firefox. The main differences start to occur with domComplete, i.e., the moment when the parser finishes its work on the main document. This underlines again the fact that Firefox’s Tracking Protection, used in Private Browsing, blocks slow third-party content from being loaded by blocking trackers.
Summary and call to action
This study shows that you can derive interesting insights from page load speed comparisons with a relatively simple approach. If you want to perform your own benchmarks and compare your favorite browser to competitors, you’re free to take this methodology and adapt it to your own tests. We have chosen news websites as our test set because we were looking for websites that have many trackers. Some ideas for extending this research are:
- Compare page load times for other sets of websites
- Extend these findings with measurements on other browsers
- Extend these desktop findings with measurements on mobile
Or, if you are up for repeating our study on your machine for the top news websites in your country, then we’d be happy if you could share the results in the comments below.
Interested in experiencing what these results mean in terms of speed? Try Private Browsing for yourself!
If you’d like to take it up a notch and enable Tracing Protection every time you use Firefox, then download Firefox Quantum. Keep in mind that Tracking Protection may block social “Like” buttons, commenting tools and some cross-site video content. In Firefox Quantum, open Preferences. Choose Privacy & Security and scroll down until you find the Tracking Protection section. Alternatively, simply search for “Tracking Protection” in the Find in Preferences field. Enable Tracking Protection ‘Always’, and you are set to enjoy both improved speed and privacy whenever you use Firefox Quantum.
About Dominik Strohmeier
Dominik works on perceived performance and Quality of Experience on Mozilla's Strategy and Insights team. He loves to improve products for users by better understanding how users use experience the browser and the Web.
More articles by Dominik Strohmeier…
About Peter Dolanjski
Peter is a Product Manager for Firefox and a defender of the open Web.


2 comments