
debugger.html is a modern JavaScript debugger from Mozilla, built as a
web application with React and Redux. This project was started early
this year in an effort to replace the current debugger within the Firefox Developer Tools. Also, we wanted to make a debugger capable of debugging multiple targets and functioning in a standalone mode.
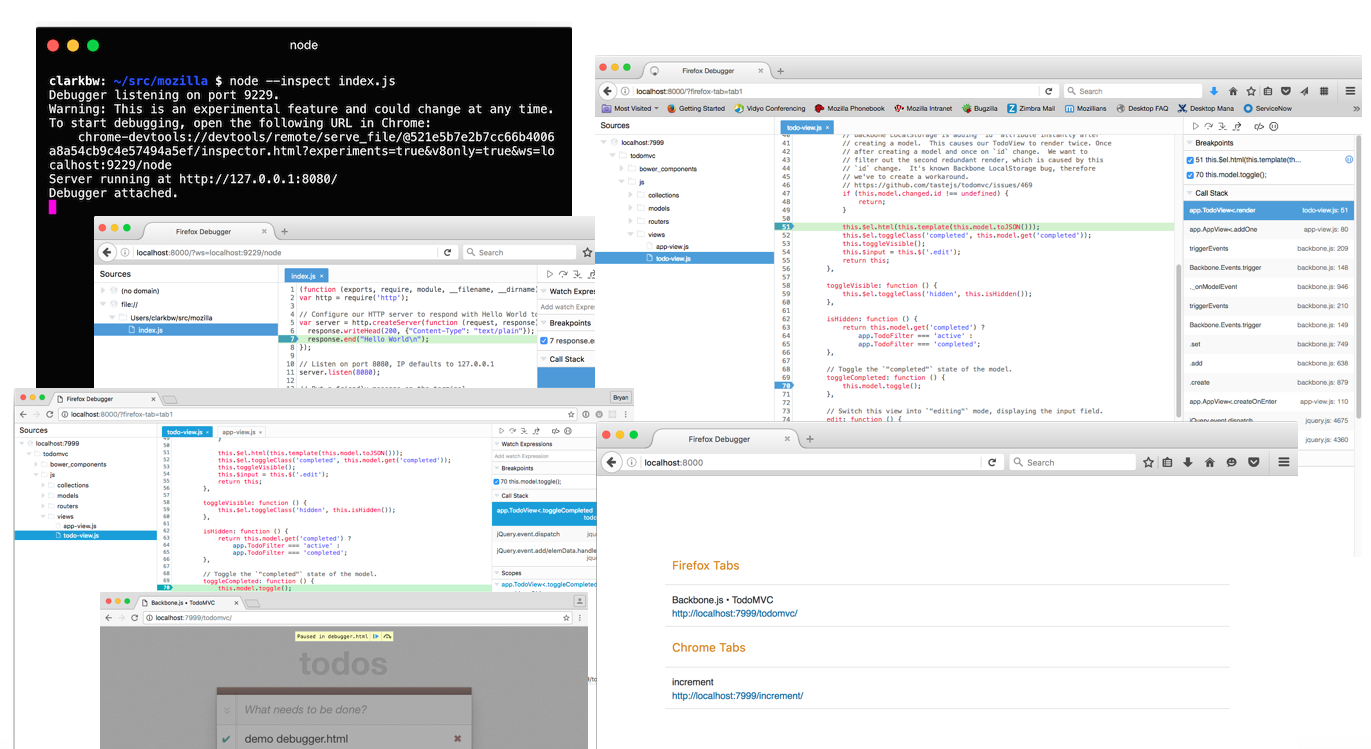
Currently, debugger.html can connect to and debug Firefox, and also connects experimentally to Chrome and Node. The debugger connects to Firefox using the Mozilla’s Remote Debug Protocol (RDP) and communicates with Node and Chrome using Chrome’s RDP.
The debugger.html project is hosted on GitHub and uses modern frameworks and toolchains, making it readily available and attractive to a wide audience of developers.
debugger.html
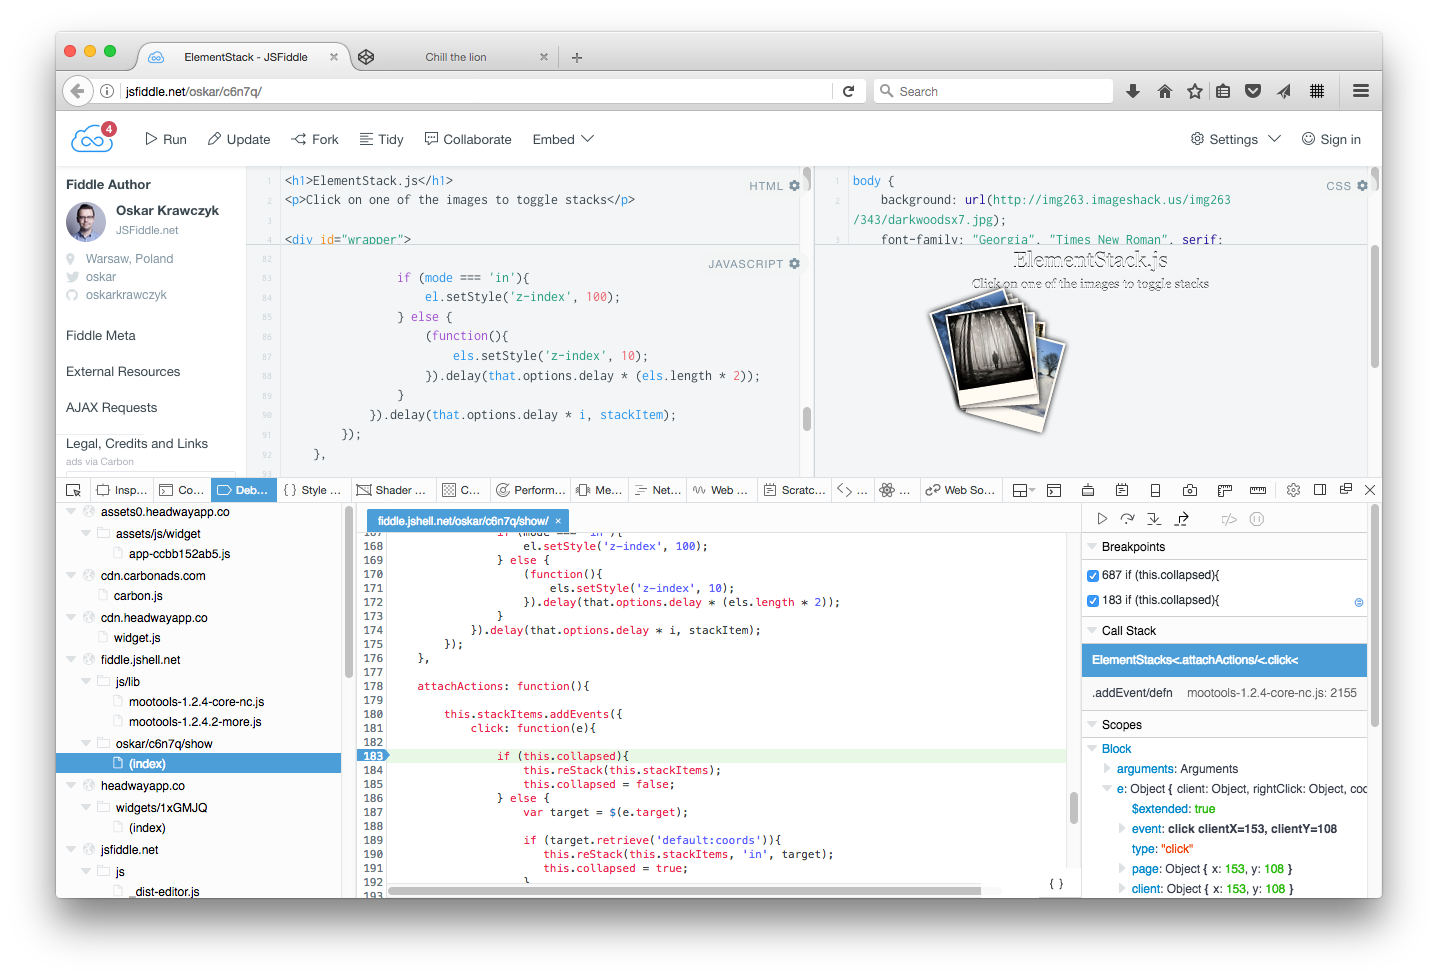
The user interface is separated into three main regions: the sources panel, the editor panel and the right sidebar.
- The sources panel displays a tree view of all the current sources for the
application currently being debugged. - The editor panel is used to display various source files from the project and provides functionality for setting breakpoints and prettifying the source.
- The right sidebar displays the current set of breakpoints, the current call stack, and scoped variables, when the debugger is paused.
- The debugger supports controls for pausing, step over, step in, step out and play functions for debugging your JavaScript.
- The call stack panel displays the call stack frames for a given pause condition and the scopes panel displays an expandable variable tree based on the selected frame.
Getting Started
To get started using the debugger you can check out the code from Github
and look through the Getting Started guide.
If you just want to dive straight in, run the following commands:
npm install - Install dependencies
npm start - Start development web server
open http://localhost:8000 - Open in any modern browser
Once you have opened the debugger in a browser on port 8000, the main
debugger page will be displayed, listing any debuggable targets that you can select. In order for the debugger to connect and debug a target it must be running with remote debugging turned on. This generally requires that you start the target with a couple of flags set. For example, you can start a Firefox instance on MacOS to enable remote debugging with the following command:
$ /Applications/Firefox.app/Contents/MacOS/firefox-bin
--start-debugger-server 6080 -P development
Other options for Chrome and Firefox are listed here.
Debugging Node requires that you have version v6.3.0 or higher installed. You will need to run Node with the inspect flag set. For example if you want to debug myserver.js you will need to use a command similar to the following.
$ node --inspect myserver.jsMore information is available in the Getting Started guide
Firefox Developer Tools
We are integrating this debugger into our Developer Tools for Firefox. The first iteration has just landed in Nightly and you can try it out there.
Getting Involved
As mentioned above, this project is still in development and we’d be grateful for your help in making the best debugger possible. If you are interested in joining us in this effort, please take a look the Contributing guide.
About Bryan Clark
Staff Technical Product Manager for Firefox Developer Tools
8 comments