
Firefox Developer Edition 50 is here. It has numerous improvements that will help you work with script-initiated network requests, tweak indexedDB data, and much more. It also introduces something special we’ve all been really wanting for a while, so let’s get right to it:
Console
A long awaited feature is finally coming to the dev tools, but we need your help in this final phase of testing. The source maps feature is currently preffed off by default, as we test before shipping it to everyone.
If you’re curious as to why this has been such a challenging issue, James Long wrote an excellent post on the matter: On the Road to Better Sourcemaps in the Firefox Developer Tools
Curious how the solution came about? I’ll paraphrase our own Joe Walker,
“Interns often don’t have all the background on how difficult bugs are, and sometimes jump into really challenging bugs—which is to say, yay interns! ”
So, a big thanks to Firefox Developer Tools’ intern Jaideep Bhoosreddy for figuring it out.
Source maps allow you to compact all your JavaScript files in one script in order to save download time for your users, or to compile from another format (like TypeScript or CoffeeScript) to Javascript, while maintaining a reference to the original files, so it’s not a nightmare to debug.
Source maps were supported in the debugger, but not in the console till now. This meant that any logged message had its location (the file and the line the log was emitted from) point to the compiled JavaScript file, but if said file was long and/or minified, this location info was barely usable.
Those times are over. The console will now show the original source, and not the compiled one anymore. You can view it in action in the gif below, with a CoffeeScript file:
Source map support is currently off by default and can be activated through a preference. Because there are various implementations in the wild depending on the tool used to build the source map file, we want to get some initial testing of the different variations. That’s where you come in.
Here’s how you can help:
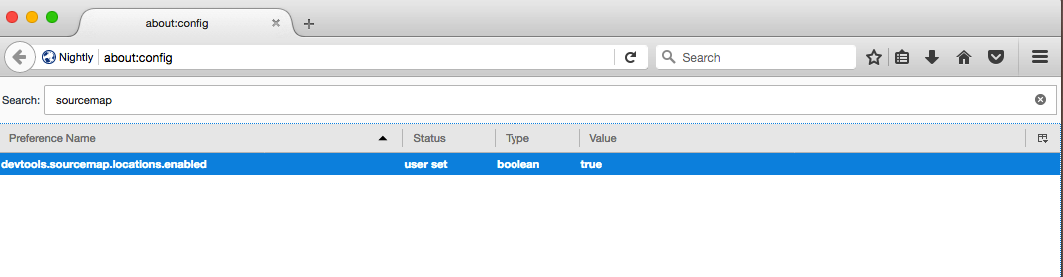
To activate source map support in the console, please set the preference on.
- Go to
about:config - Search for
devtools.sourcemap.locations.enabled - Double-click the line to toggle the value to
true - Close and re-open the web console
If you see anything that looks wrong, shout out to @firefoxdevtools on Twitter or let us know on the #devtools channel on IRC.
Network Stack Trace
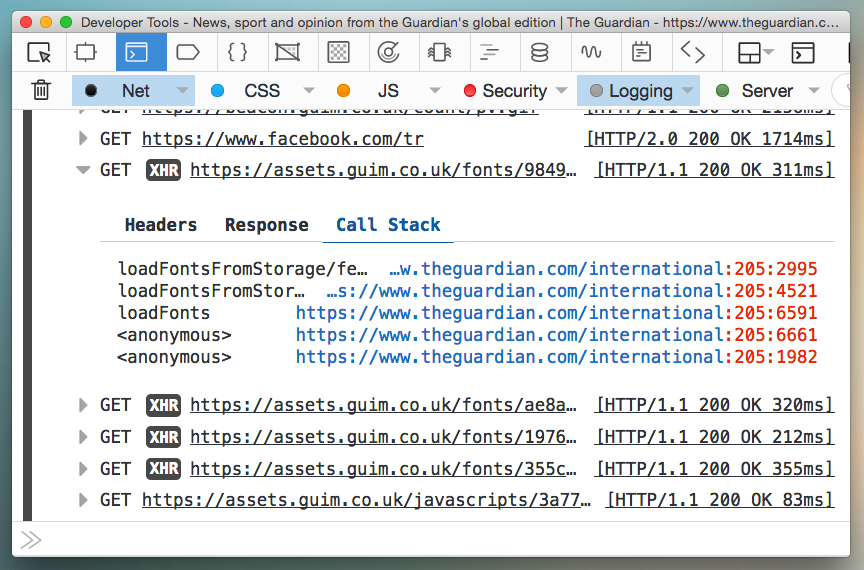
In Firefox Developer Edition 50, the console now shows the stack trace that led to a network request in HTTP log message. This is on by default.
Memory Tool
The Memory Tool is also now enabled by default. This is a must-have tool for debugging and maintaining top-notch app performance. It helps you to find and fix memory leaks in your application. If you want to learn more about it, check out the article on MDN or go read the Hacks post on Firefox’s New Memory Tool.
Network Monitor
In Firefox 49, the “Cause” column was added. It shows how a given network request is initiated, its type and, if available, the stack trace that led to it. The stack trace bubble now shows the frame asynchronous cause (XHR, Promise, setTimeout, etc.), similar to the debugger stack trace panel.
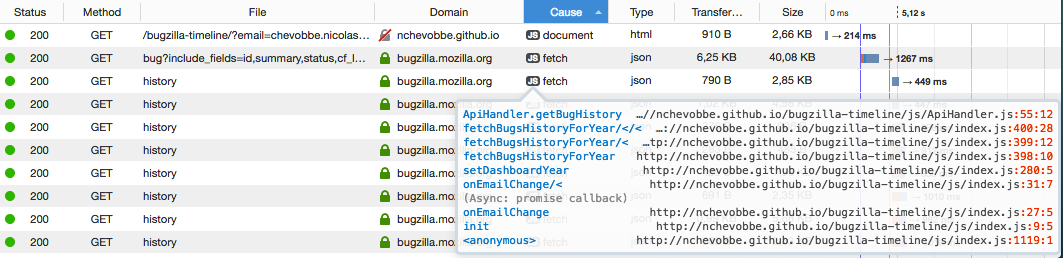
Furthermore, entries can be sorted by their cause by clicking on the column header. This could be helpful to quickly find all the network requests that were initiated by fetch for example.
JSON Viewer
The JSON Viewer was refined and shows data in a smarter manner:
- Empty arrays are displayed as
[](was[0]), to match empty object syntax, which is{}. - Colon separators are now also shown for object properties, like the other property types.
Storage Inspector
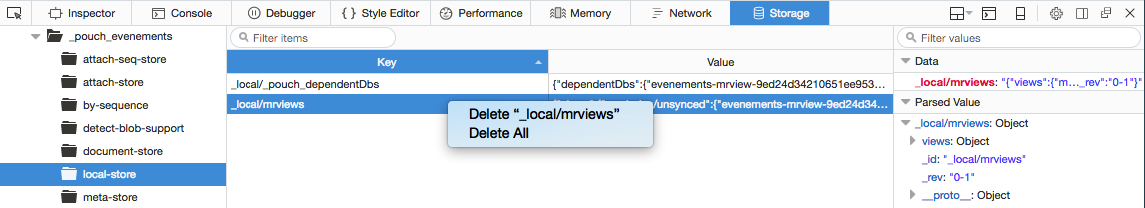
Following the global effort by Mike Ratcliffe and Jarda Snajdr to improve the Storage Inspector, it is now possible to remove a single indexedDB entry through the context menu.
about:debugging
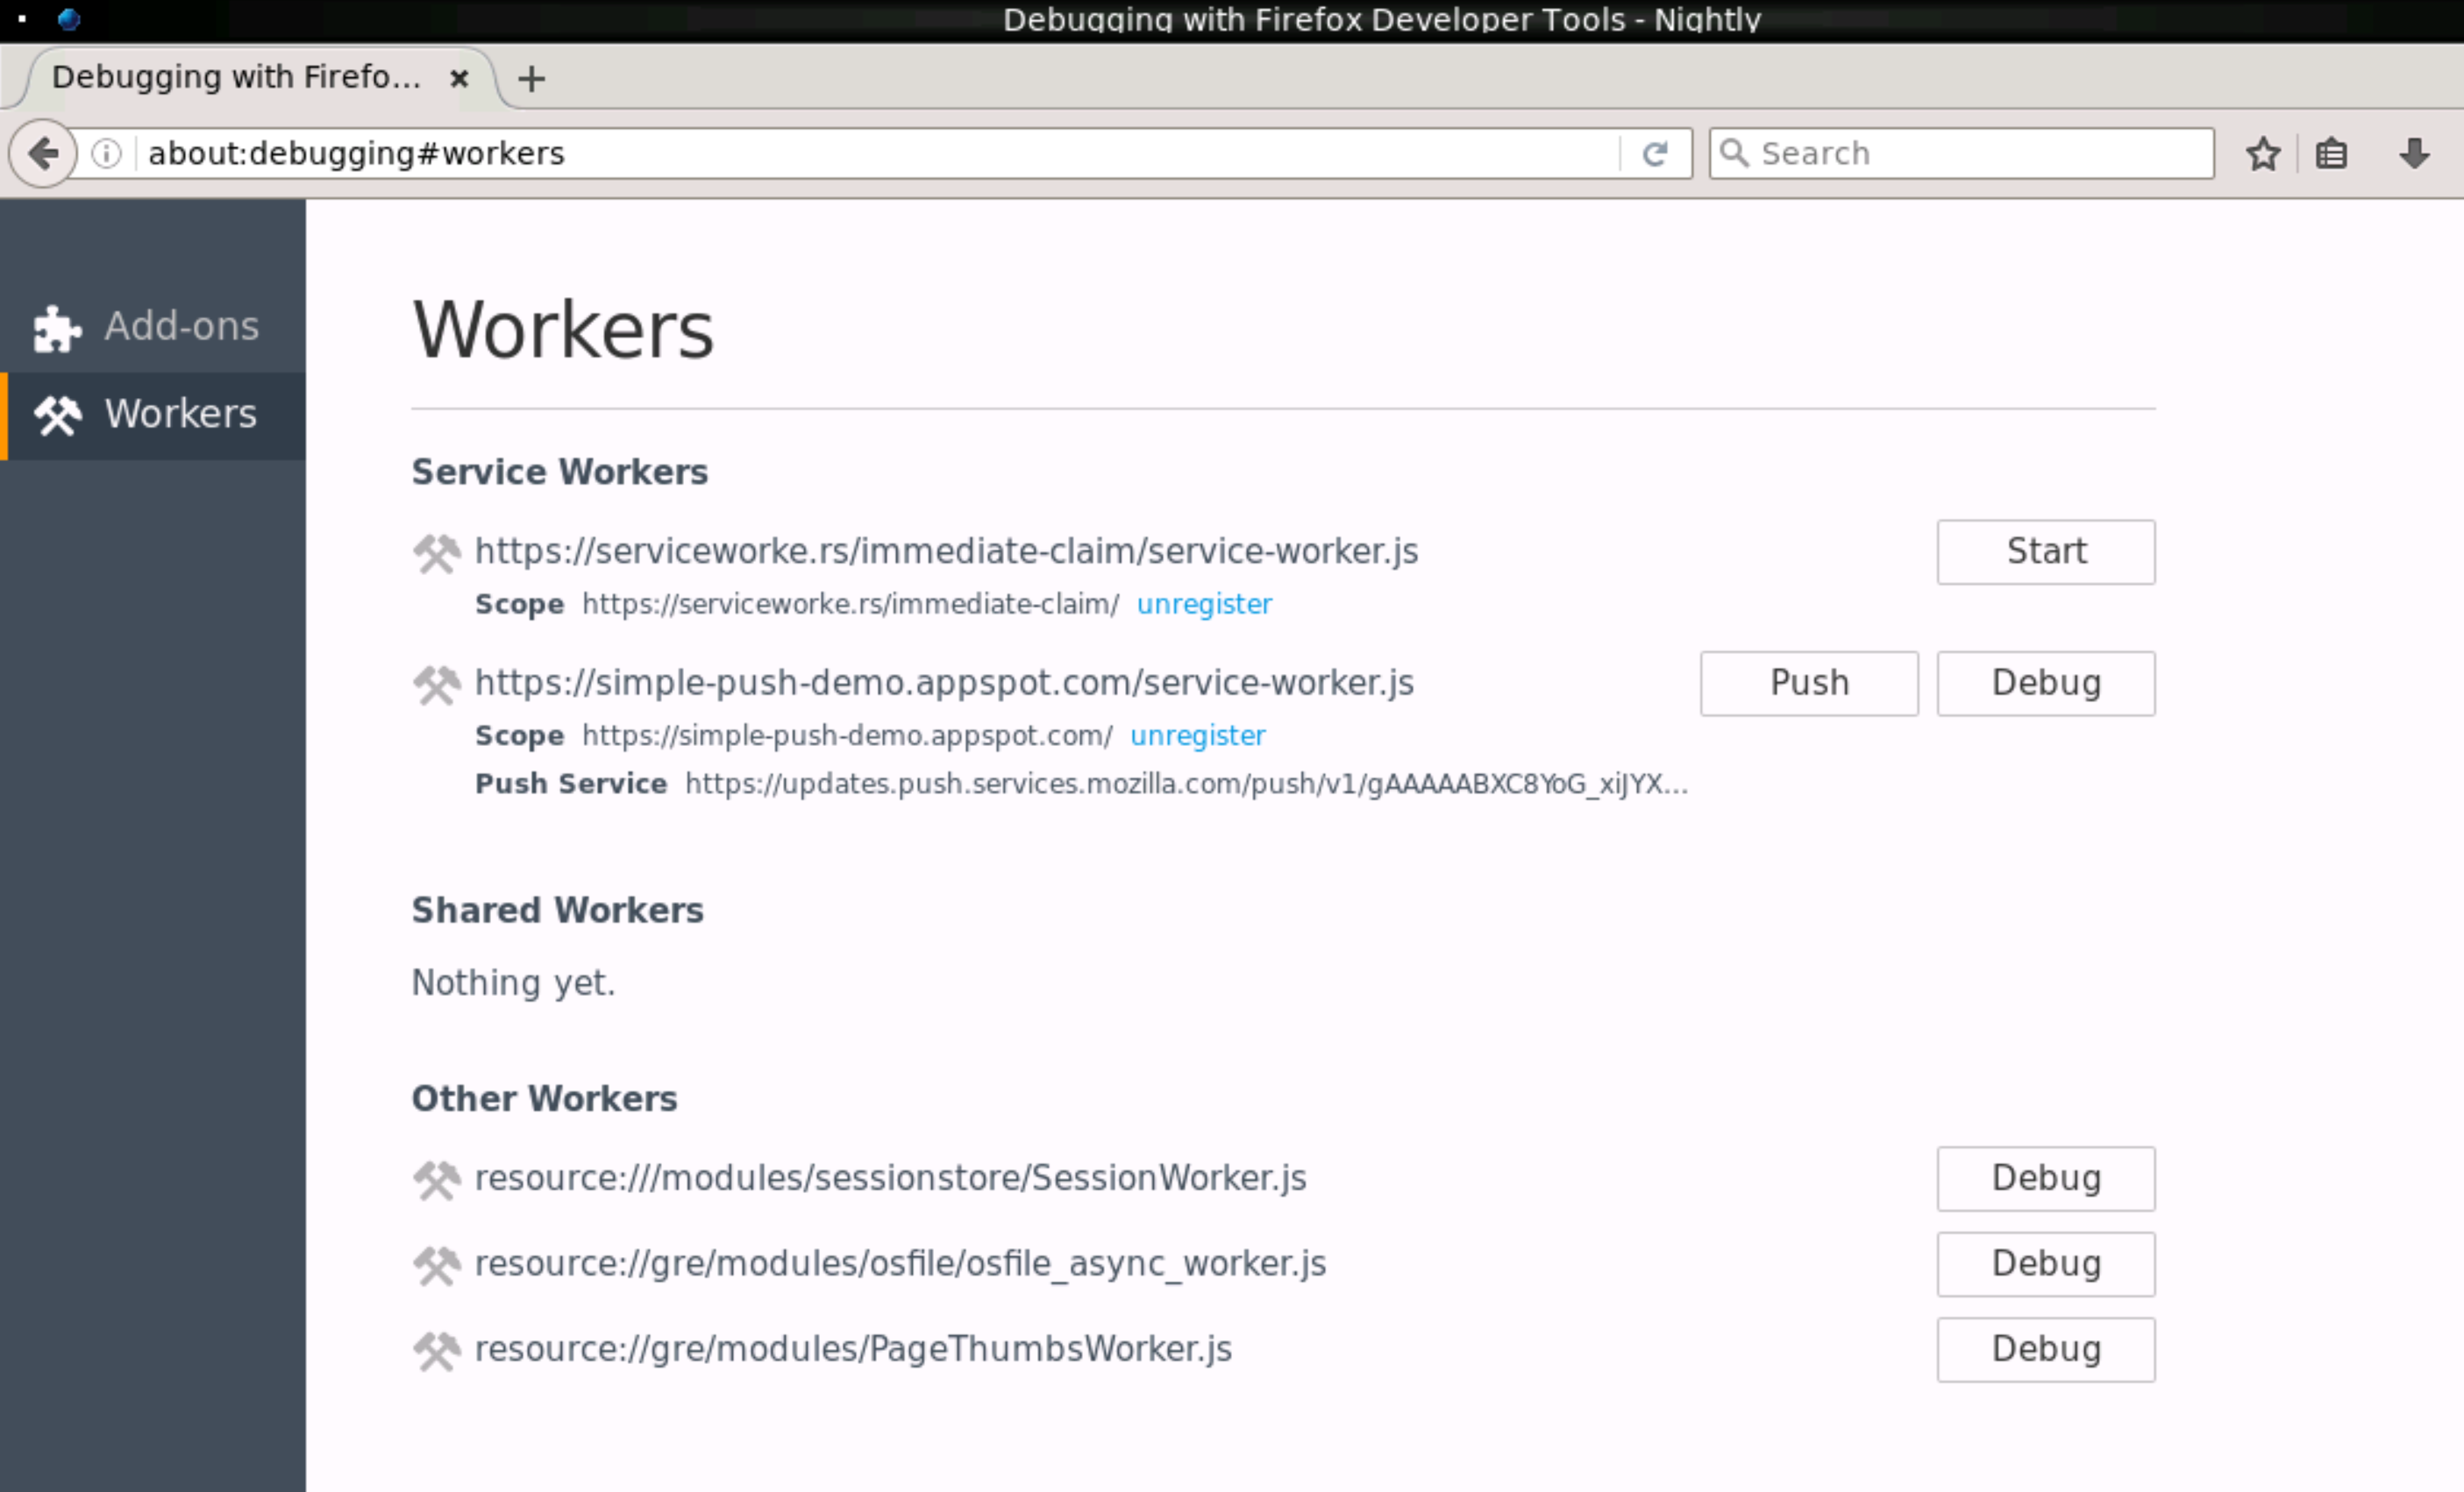
Service Workers are definitely the next big thing in Web development, providing a whole set of tools you can use to build progressive web apps that match native apps in functionality, with offline capabilities and push notifications.
Did you know that you can manage registered Service Workers in the about:debugging#workers page? This page now also shows push subscription endpoints and allows you to send a test notification with no more effort than the click of a button.
Other Notes
Icons: Icons across all the developer tools got even better in Firefox 50. They are now more consistent and look sharp as a knife.
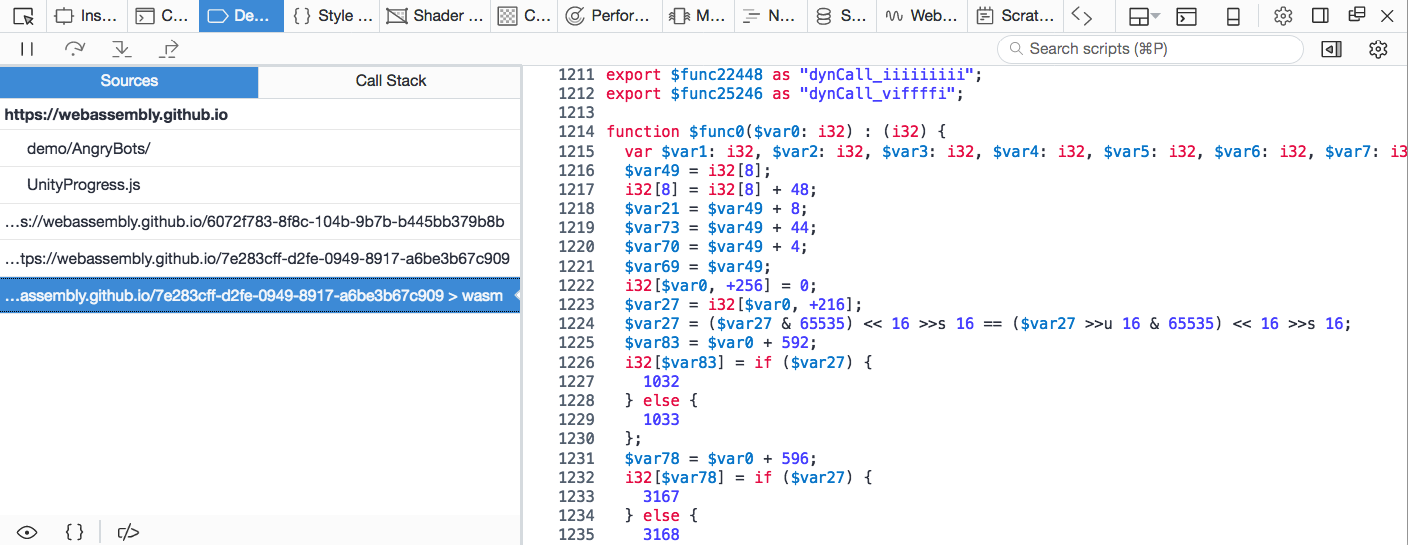
WebAssembly: As Luke Wagner said in a previous blog post :
“WebAssembly is an emerging standard whose goal is to define a safe, portable, size- and load-time efficient binary compiler target which offers near-native performance”
WebAssembly files were already supported in the debugger, and they are now highlighted which make them look much nicer.
And to wrap up, a minor but useful change: the Style Editor can now be disabled to save some space if you don’t use it.
With that, we’ve completed the overview of Developer Edition 50. Download the latest update now and let us know what you think. One last thing, though. A lot of the improvements we covered in this post were made possible by awesome contributors. Big thanks to all of you.
The dev tools are written using standard HTML, Javascript and CSS, so if you have any front-end development experience, you can contribute too. If you want to help the dev tools to get even better, you can find easy bugs to start with in http://firefox-dev.tools/. Everyone is welcome!
2 comments