
This week marks the release of Firefox Developer Edition 48. In preparation for the arrival of multiprocess Firefox and the deprecation of the Firebug add-on, we are porting Firebug features to the built-in tools. We have also made tweaks to the current tools that we’ll cover in this post.
Firebug theme
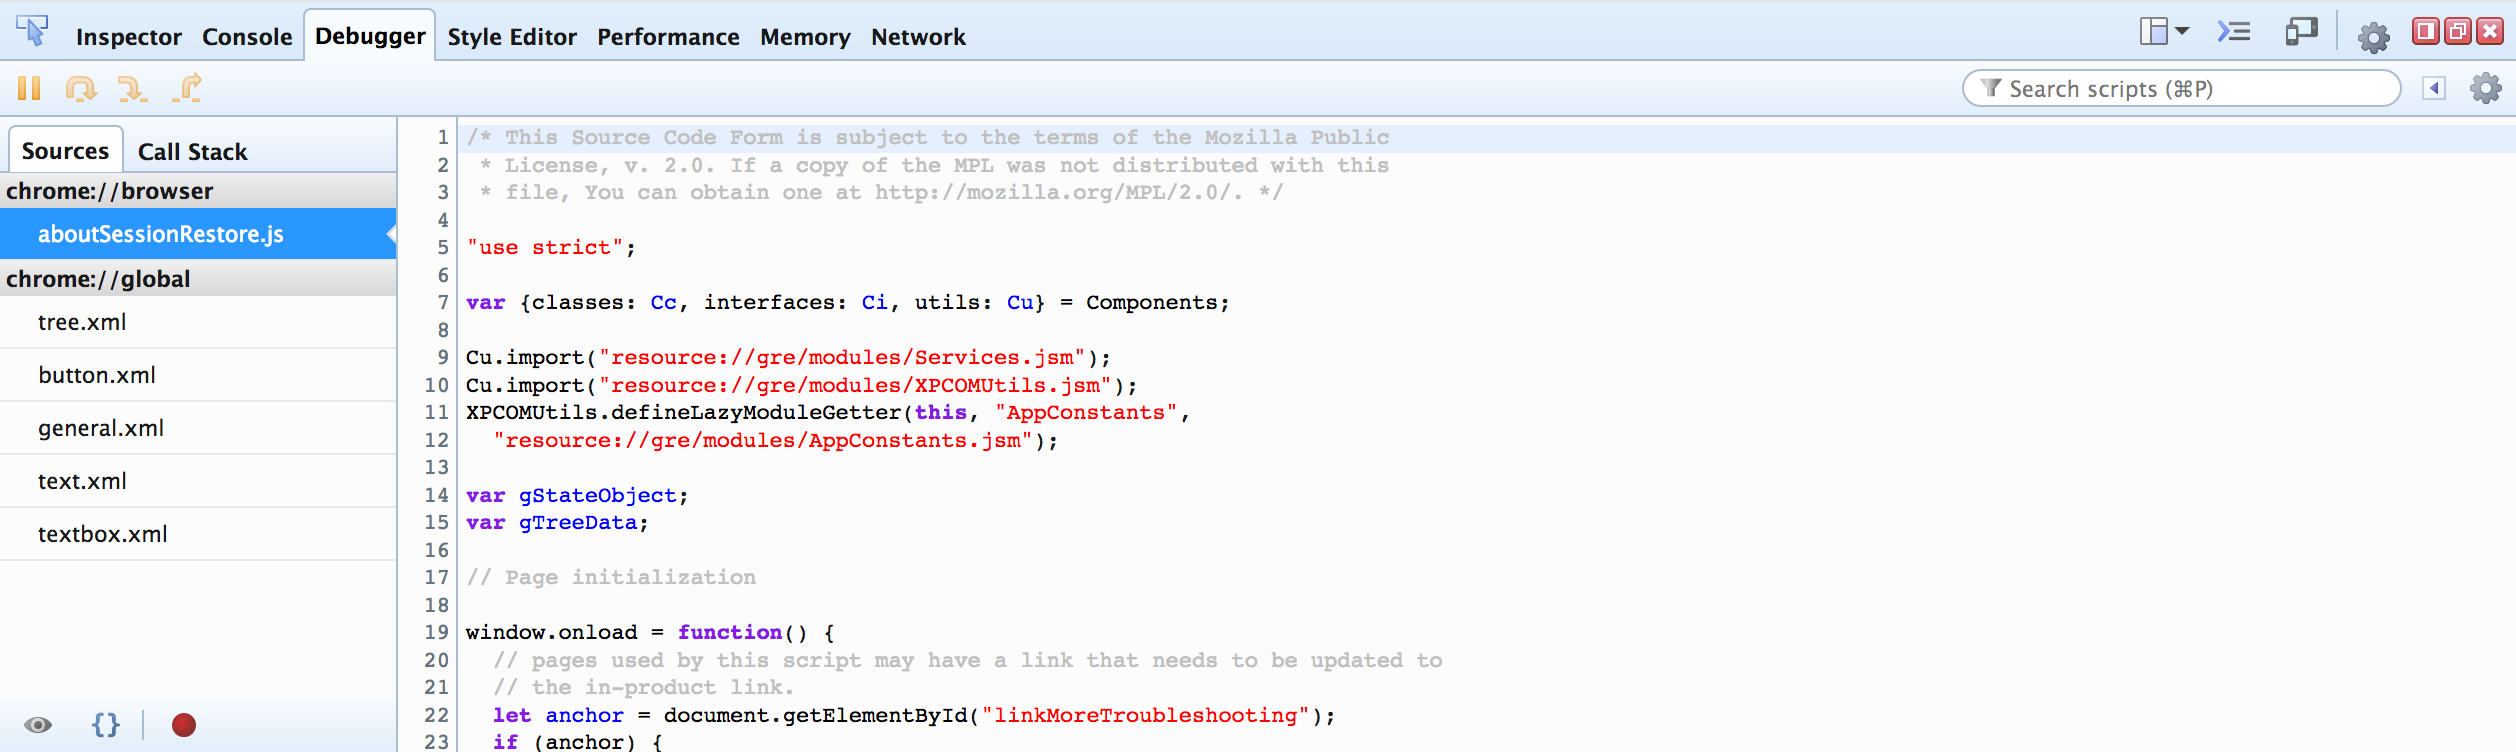
As part of porting Firebug features to the built-in tools, we’re also porting the Firebug theme, giving Firebug users a more familiar environment to work with. This is the initial release of the theme so please let us know if you find any bugs and report them here. Here is a screenshot of the Firebug theme:
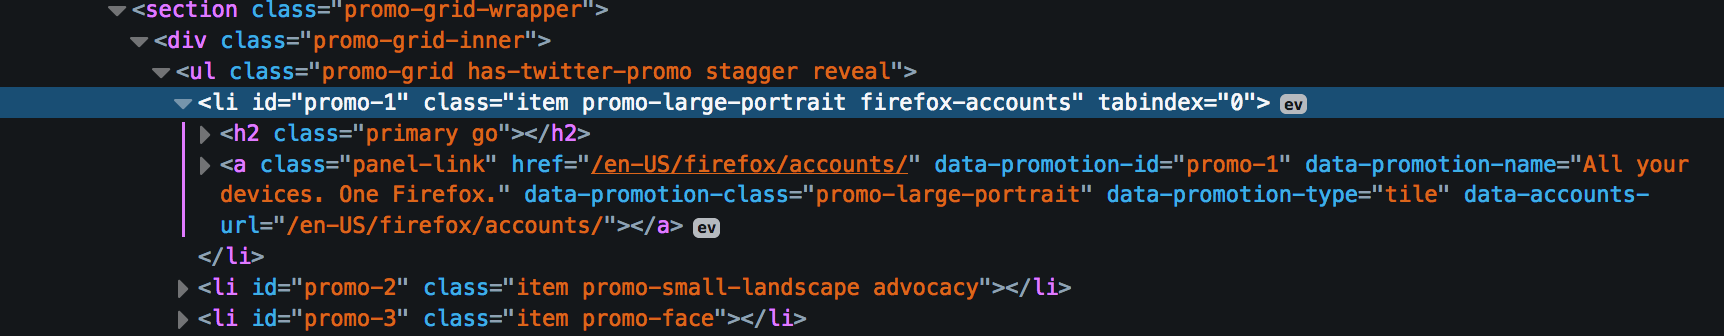
DOM panel
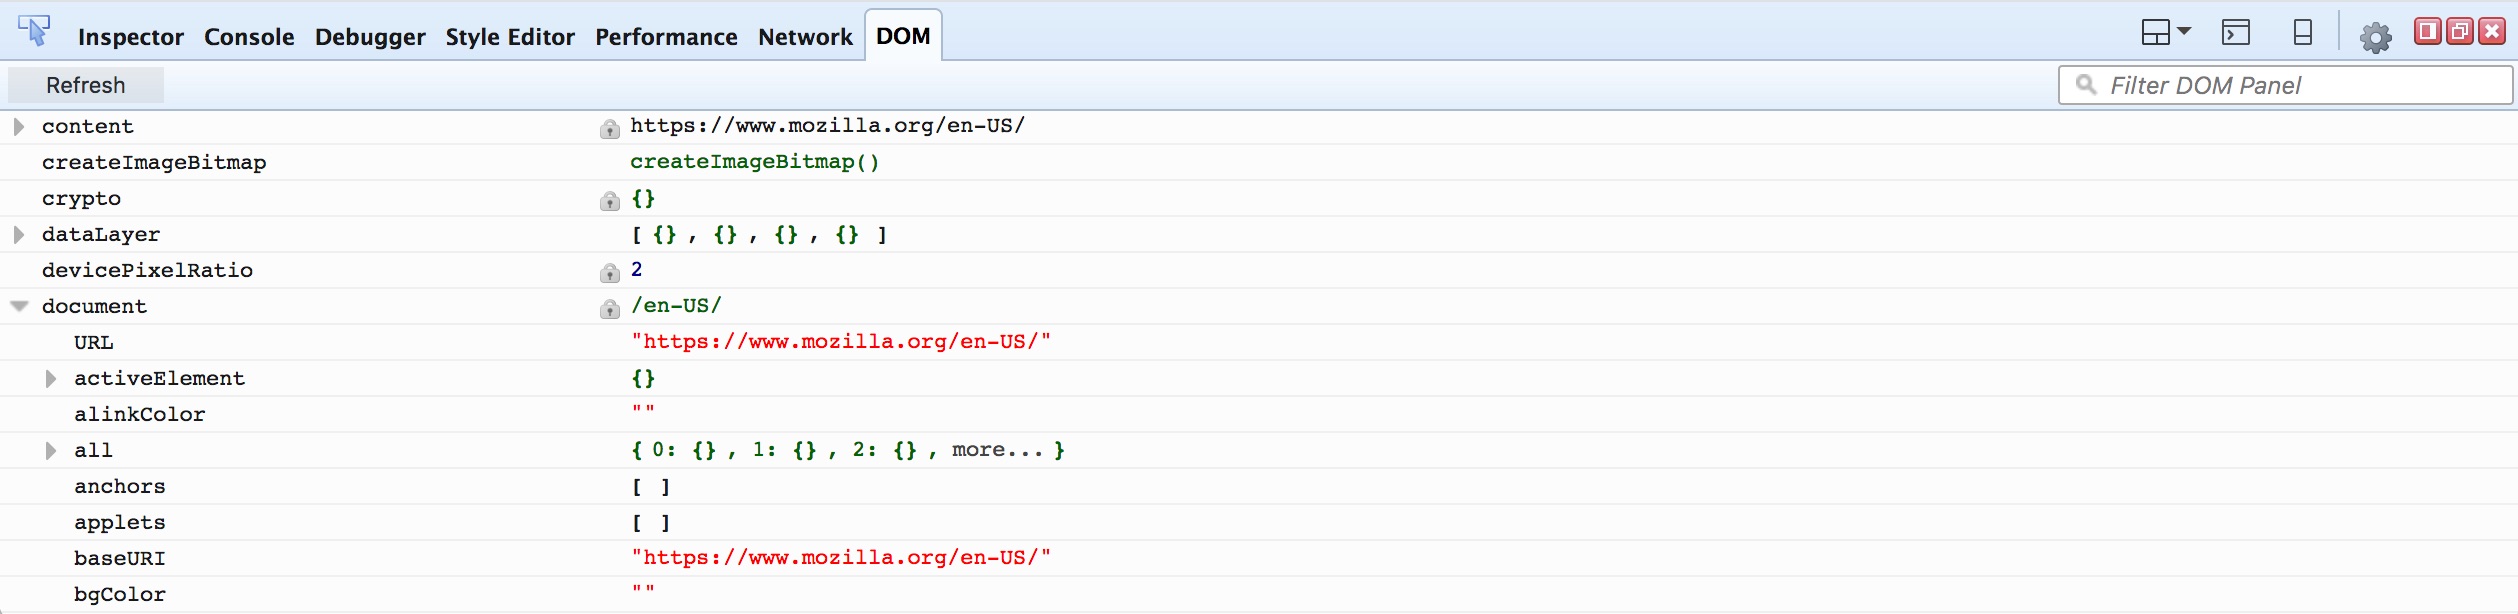
The DOM panel is another feature we are porting from Firebug. This panel provides a handy tree view which allows you to browse and inspect the DOM structure of your page. Here’s a screenshot of the new tool:
Editable storage
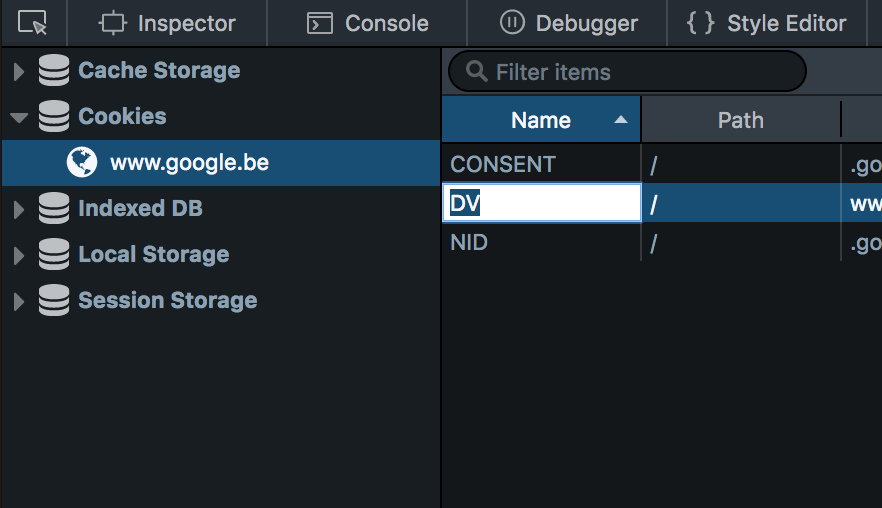
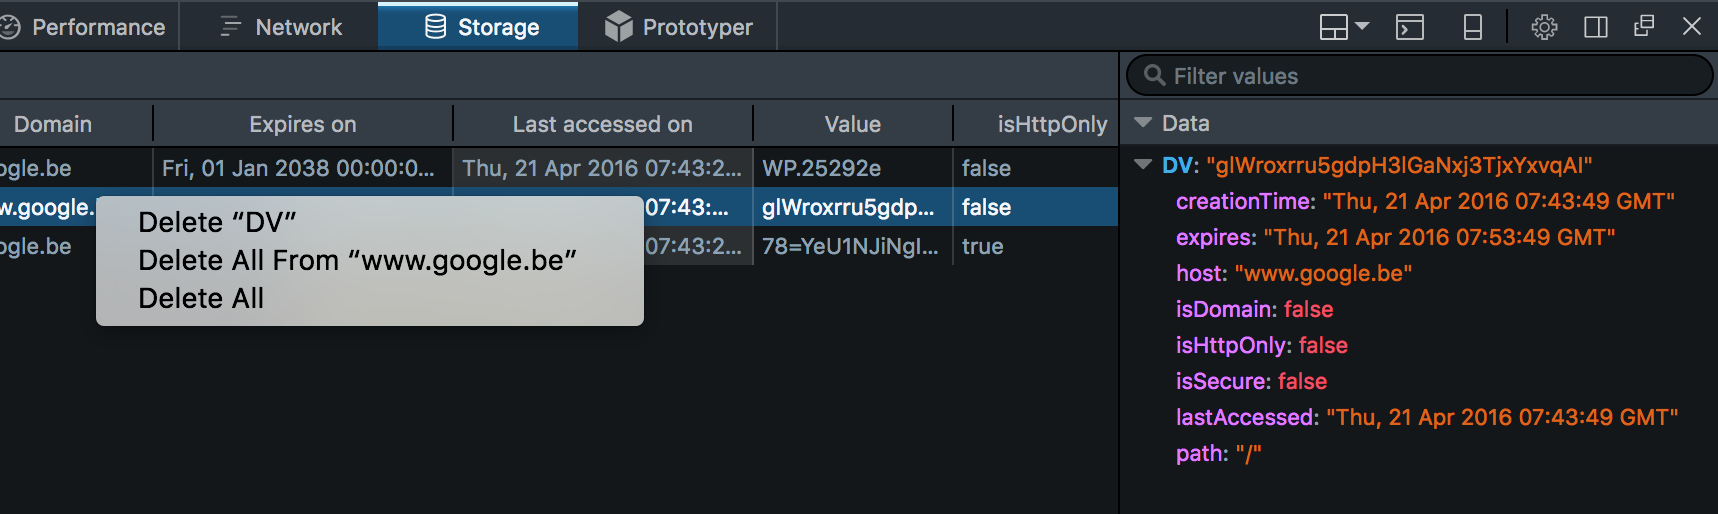
Editing support inside the storage inspector is one of the most frequently requested features. In this release, we added the ability to edit and delete cookies, local storage, and session storage entries. You can edit a cell by double-clicking on it. You can also delete entries by using the context menu.
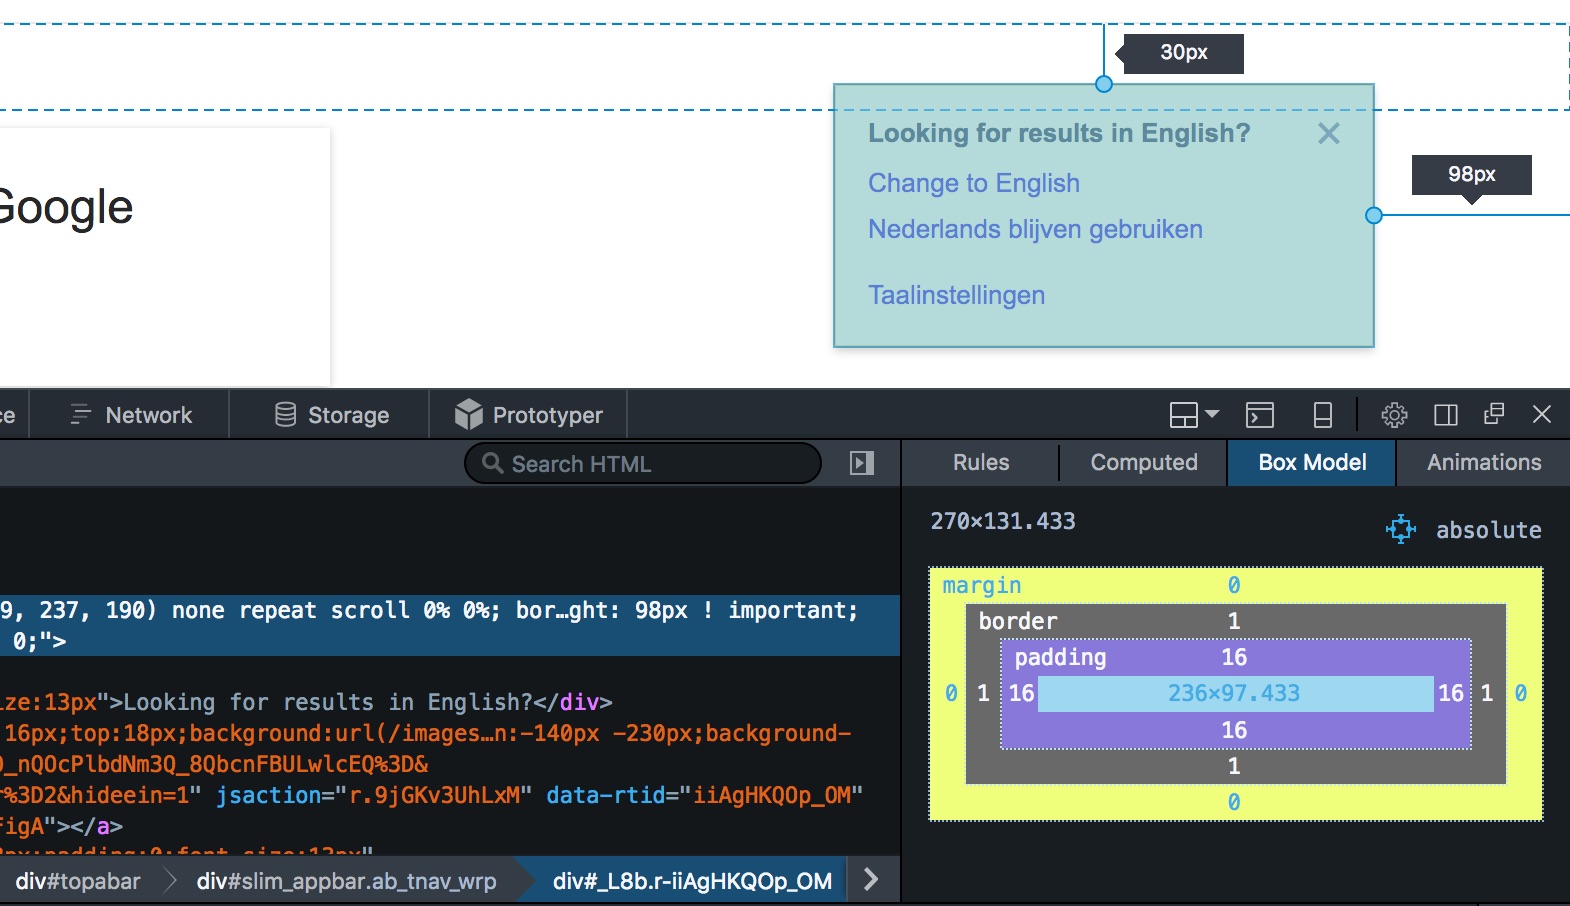
Geometry editor
In this release, we have added a new visual editing tool that allows you to easily tweak the positioning of any absolutely positioned or fixed-position element. You can change the values of the top, left, bottom and right properties using this tool. To launch the geometry editor, go to the Box Model tab in the inspector and click on the ![]() icon.
icon.
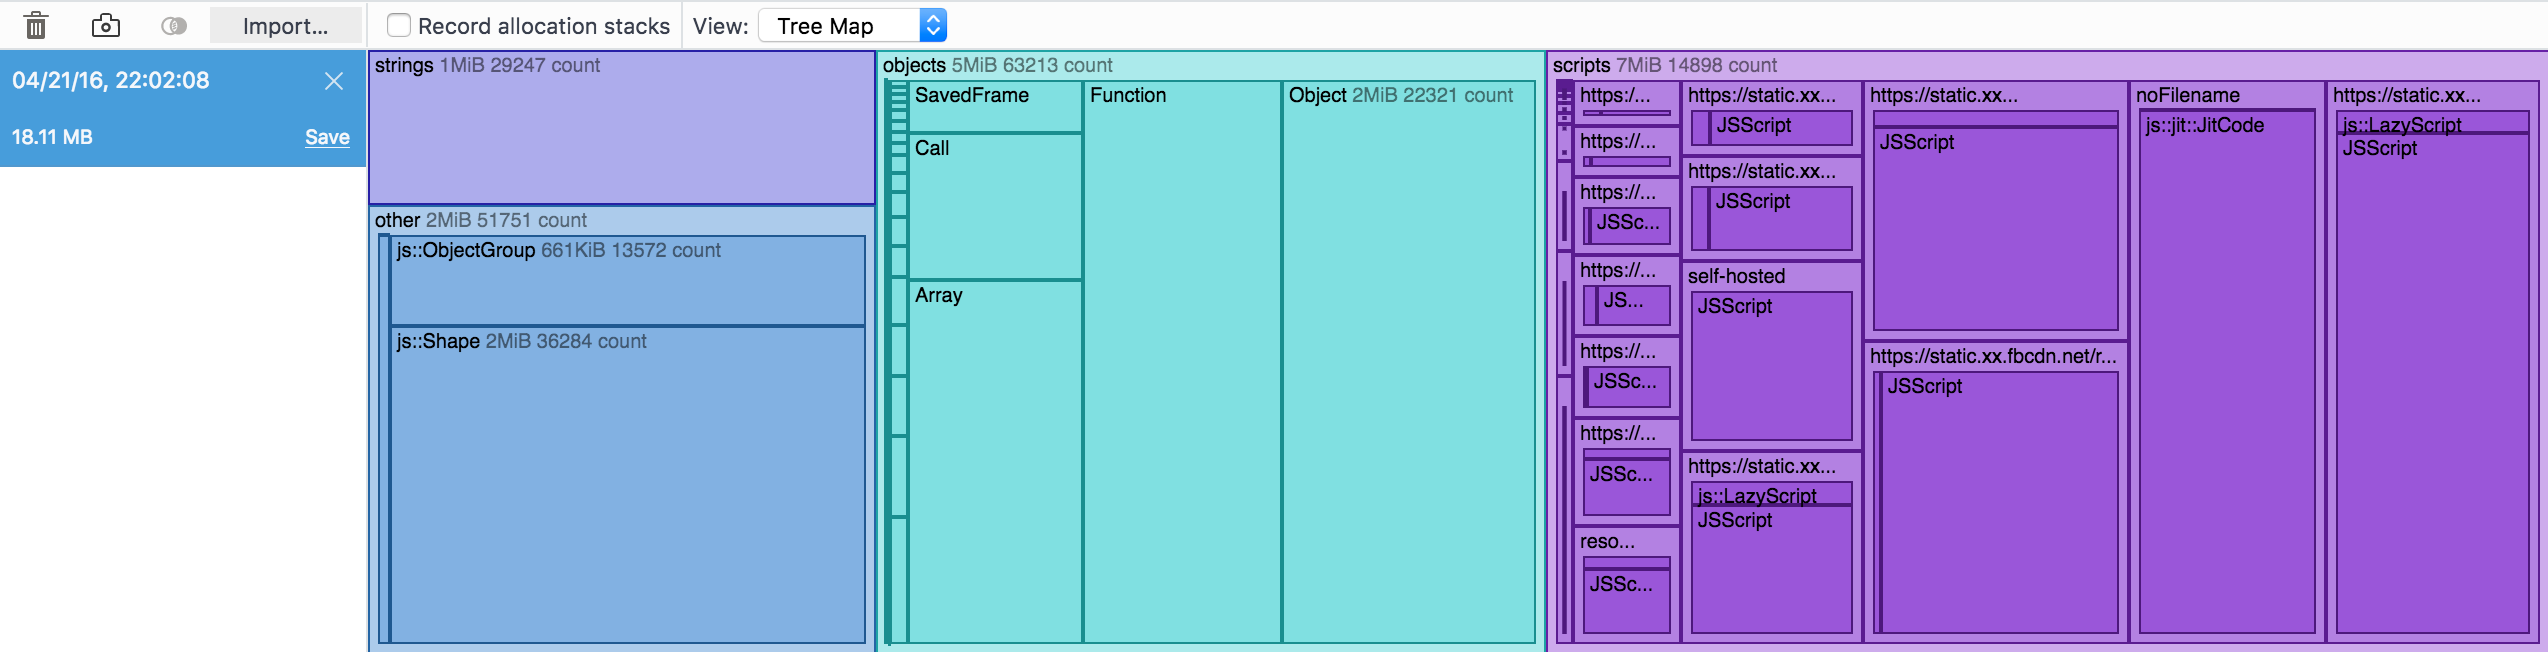
Memory tool improvements
The memory tool is now enhanced with a brand new tree-map view that gives a quick and intuitive visual overview of how memory is being used. This new view groups objects together by their types, which allows you to easily see the quantity of similar items (arrays when drawing canvas lines, scripts when loading a script-heavy website, etc.) taking up memory. Also, the size of each item in the map is proportional to the amount of bytes used, which allows you to easily see which items are taking up most of your memory.
The memory tool provides a useful aggregate view that groups all instances of the same type of node. In this release, you can now click the ⁂ icon to view all individual instances of a specified type in a separate view. You can also view the retaining paths of those individual nodes, using the retaining paths panel added in the previous release. This allows you to precisely pinpoint how a specific object is leaking when debugging your web app.
Finally, we have also added the ability to remove individual snapshots from the memory tool sidebar.
Inspector improvements
We have polished the user experience in the inspector to make it smoother and easier to use. The Rules view autocomplete now selects the most used property by default to make your authoring experience faster. For example, background will be selected instead of backface-visibility because it’s more frequently used. Here is a screencast of the feature in action:
We have also improved the way long values are handled in the Rules view. A new multi-line mode specifically for long values lets you conveniently reach and select different parts of the value you’re editing.
The markup view now emphasises the relationship between a parent node and its children. The selected element now has a line underneath it that highlights the child nodes. This allows you to easily spot the selected element child nodes when the HTML markup is complex.
A quick way to switch between different angle units in the Rules view has been added. There is now a swatch next to angle values which you can shift-click to cycle between different units, similar to the colour values interaction. This feature was added by contributor Nicolas Chevobbe.

Finally, we have added keyboard shortcuts to easily navigate between the markup view search results. You can now use Shift+Enter to navigate backwards within the search results. Also, Ctrl/Cmd+G and Ctrl/Cmd+Shift+G now work as aliases for Enter and Shift+Enter. These keyboard shortcuts were added by contributor Steve Melia.
Console improvements
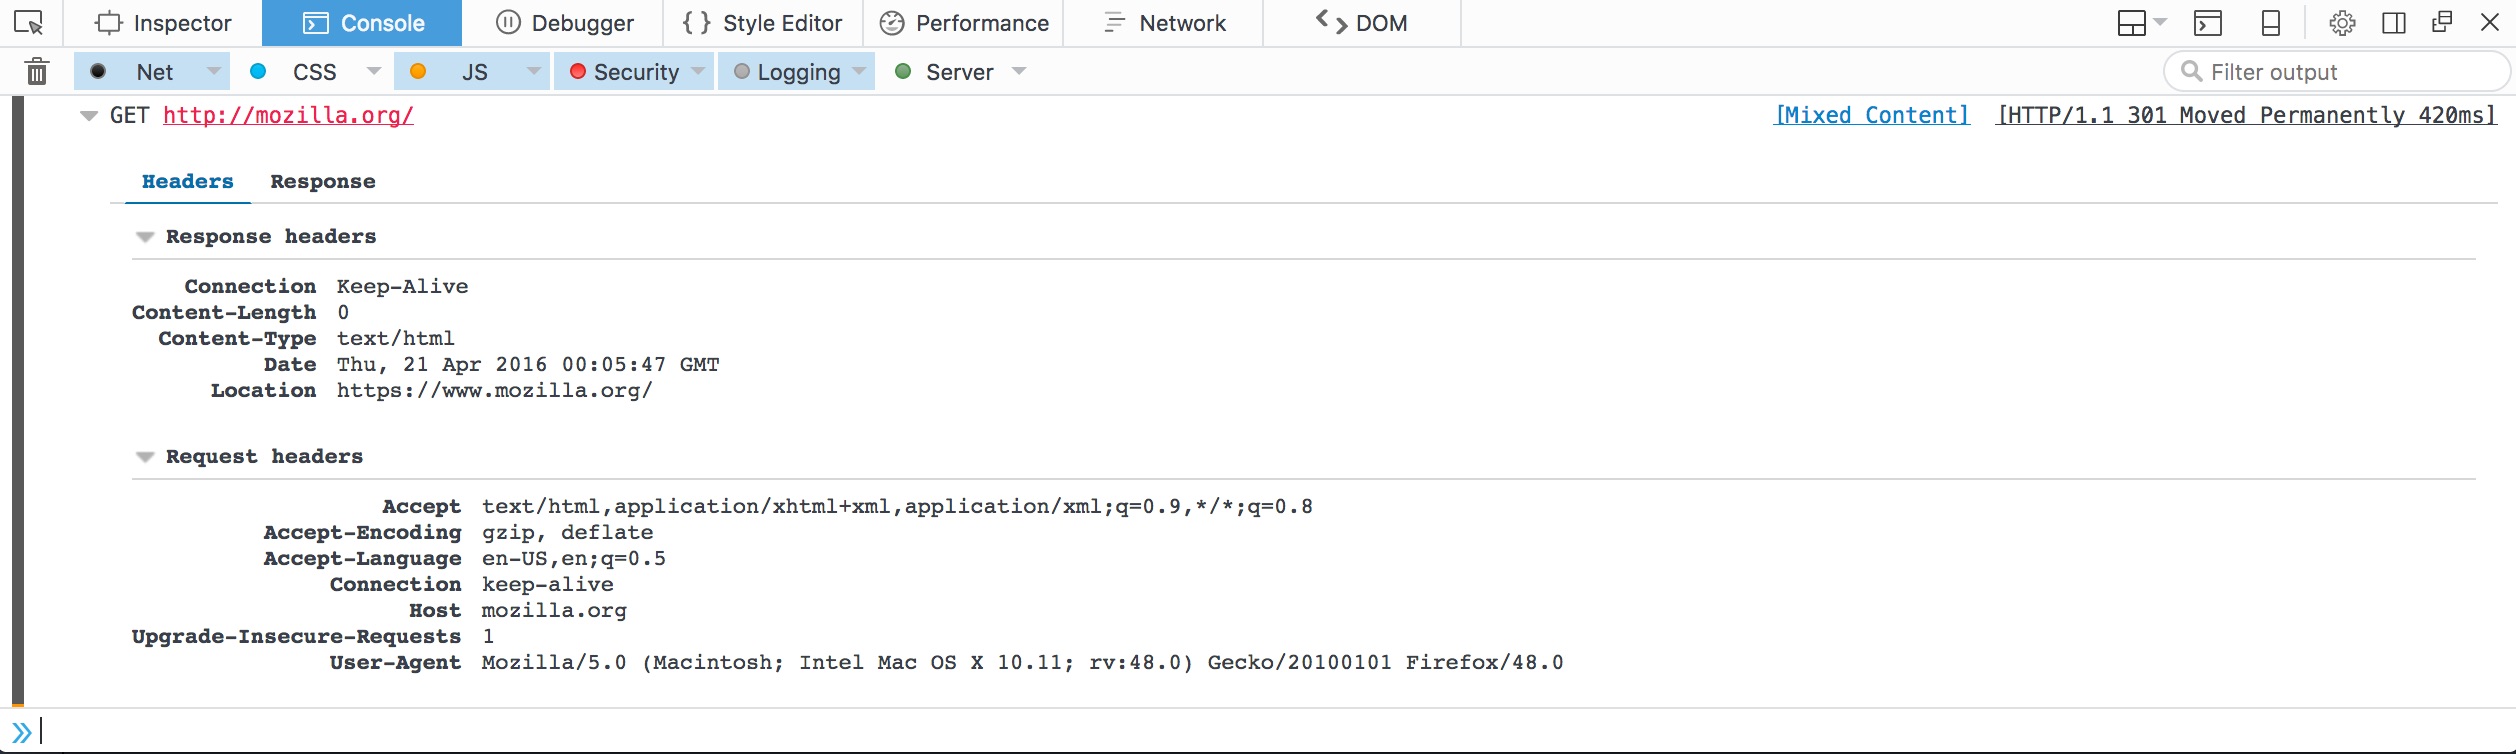
The console has also received various tweaks that will make your daily experience with the tool more enjoyable. The first improvement comes from the set of Firebug features we’re porting. You can now expand network logs to inspect them and reveal a Firebug-style details view. Here is a screenshot:
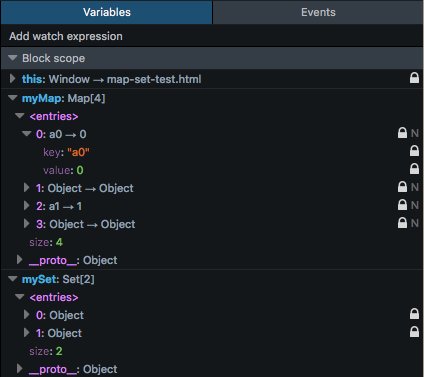
If you’re working with Map or Set objects, you can now view and inspect their individual entries from the console sidebar. This feature was added by contributor Jarda Snajdr.
Finally, we have added support for console.clear() to clear the console output.
about:debugging features
In preparation for the release of WebExtensions, we’ve added a feature that will be a great help to add-on developers. You can now reload add-ons from about:debugging, which allows you to quickly develop your add-on without having to re-install it every time you make a change.

If you’re working with Service Workers, you’ll notice that we have added a way to unregister individual workers. Here is a screenshot:

Other notable changes
In addition to the changes above, we have polished various areas of the toolbox including:
- Breadcrumbs have been moved to the bottom of the inspector panel. (Bug 1256422, development notes)
- There is now a button to create a new node in the inspector. (Bug 1261781, development notes)
- Switching between files in the debugger is now faster. (Bug 1233927, development notes)
- Improved performance when selecting long values in storage inspector. (Bug 1156720, development notes)
- The breakpoint user experience has been improved to be less confusing. (Bug 1245030, development notes)
- New icons in the toolbox tab bar. (Bug 1225184, development notes)
- The clear icon has been updated (Bug 1251256, development notes) and is now placed consistently across tools. (Bug 1220208, development notes)
Thanks to everyone who contributed to this release! Make sure to grab a fresh copy of Firefox Developer Edition and share your thoughts! If you have feedback about different Firebug features being ported, we’d love to hear your suggestions and constructive comments here.
About Tim Nguyen
I work on web browsers.
15 comments