
You might have already heard about our effort to unify native Firefox Developer tools (DevTools) and Firebug. We’ve been working hard to port all favorite Firebug features into native DevTools, make them multi-process compatible, and available for remote debugging (i.e., e10s compatible). We’ve been also working hard to make the transition path from Firebug to DevTools as simple and smooth as possible. Yes, as we’ve mentioned before, we’re focused on developing one great tool for developers!
So, let’s see how it looks now.
The main goal of next-generation Firebug is to help users feel at home when working with native DevTools. This is where Firebug 3 (aka Firebug.next) comes in. Firebug 3 is not another developer tool, it is rather a thin layer built on top of DevTools, providing a new theme that makes DevTools look like Firebug. There are also a few additional features, that we’ll port into DevTools step by step.
If you are missing any features (e.g. some of those you’ve been using in previous versions of Firebug), you should expect them to be part of DevTools in the future.
Firebug 3
Take a look at the screenshot below showing what DevTools look like if you install Firebug 3 (first beta). Does this look familiar?
Firebug 3 (aka Firebug.next) isn’t distributed through AMO yet, so you might need to set the xpinstall.signatures.required preference (through about:config) to false.
It’s the Firebug theme ported into DevTools to bring some UI and layout advantages. There is also the well-known Firebug start button in the Firefox toolbar, which represents the entry point to the developer toolbox.
See, the Firebug Theme option is currently active.
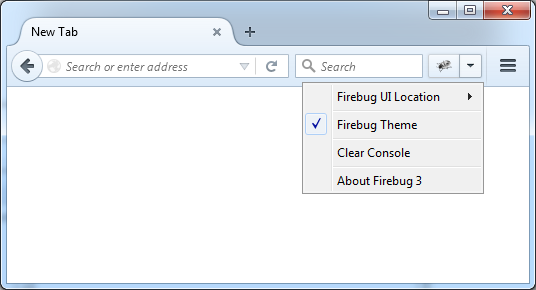
The process for entering your handy tools is exactly the same: you can either press the start button or the F12 key.
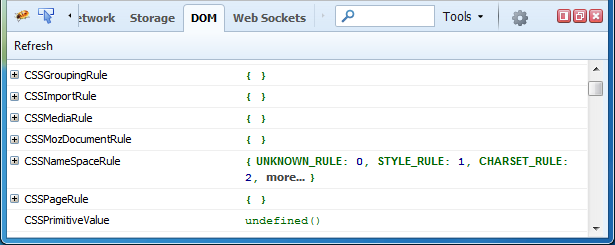
You might be a fan of the DOM panel used to inspect the document object model of the page you’re on. It isn’t supported natively (yet) and so, Firebug offers it to you.
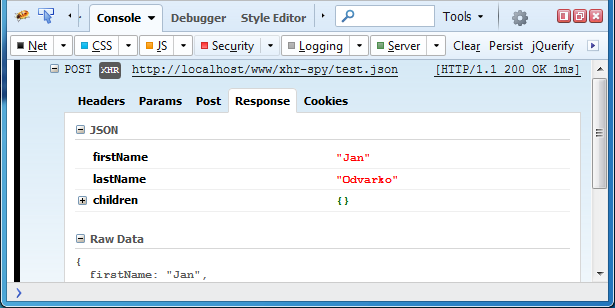
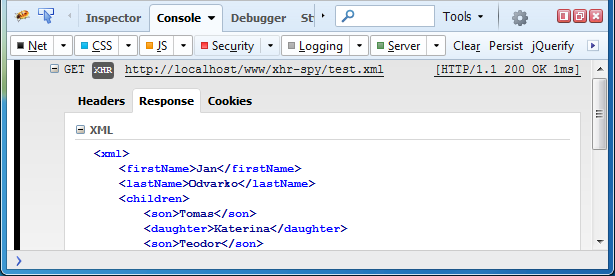
XHR previews in the Console panel (requested many times) are also supported.
Some of the most popular extensions have been re-implemented on top of DevTools. Not only does this keep popular features alive, these implementations also provide great examples of how you can make new extensions directly for DevTools. Firebug isn’t required to run these extensions.
If you are an extension developer you might be interested in some examples and links to other resources helping to understand how to extend DevTools.
Let’s see what extensions are available.
FireQuery extension
FireQuery is a Firefox plugin for jQuery development built on top of DevTools in Firefox. Firebug 3 isn’t required, but some of the screenshots below show DevTools with the Firebug theme activated (the other themes, Light and Dark, are also supported).
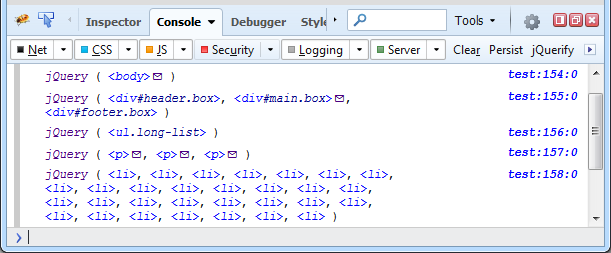
Elements with jQuery data associated display a little envelope icon in the Console panel. You can inspect it by clicking on the icon. There is also a jQuerify button in the Console panel toolbar and you can use it to load jQuery into the current page.
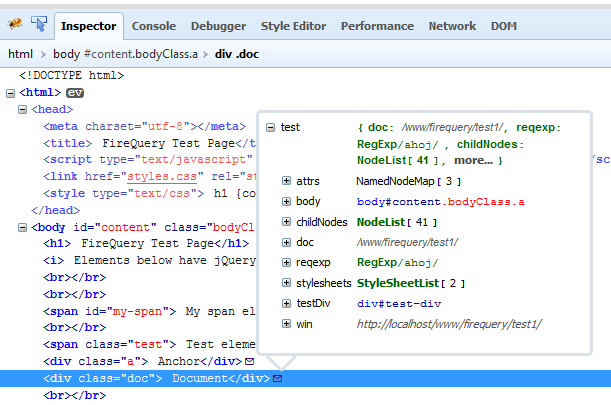
The Inspector panel also displays the envelope icon for elements with jQuery data. Clicking the icon opens a popup with details.
- See the FireQuery home page.
- Download the add-on from AMO.
- Try it out with this online test page.
PixelPerfect extension
Pixel Perfect is a Firefox extension that allows web developers and designers to easily overlay a web composition with semi-transparent layers (images). These layers can then be used for per pixel comparison between the page and a layer.
There is a Pixel Perfect start button allowing quick access to this feature.
![]()
And here is the final Pixel Perfect UI that you can open by clicking on the button above.
![]()
- See the Pixel Perfect home page.
- Download from AMO.
HAR export
Support for exporting HAR (the HTTP Archive format) from the Network panel is now a built-in feature and you don’t need an extension for it. All you need to do is select the Network panel (reload the page if necessary) and use two context menu actions:
- Copy All As HAR: copy collected data into the clipboard.
- Save All As HAR: save collected data into a file.
Exporting data from the Network panel is often automated (e.g. when testing web applications using Selenium). If you want to create a HAR file automatically for every loaded page you need to set the following preference (use about:config) to true:
devtools.netmonitor.har.enableAutoExportToFile
Some automated systems need more flexibility than just creating a HAR file after every page load. Sometimes you need to send data to a remote server, collect and export HAR between two specific user actions, etc. That’s why we’ve introduced a simple HARExportTrigger extension that improves automation by exporting HAR API into the page content. This allows you to use small script to trigger HAR at any time.
Here is an example script that gets HAR data from the Network panel:
var options = {
  token: "test",
  getData: true,
};

HAR.triggerExport(options).then(result => {
  console.log(result.data);
});
- See HAR Export Trigger home page
- Download the add-on from AMO
Using console.* APIs on the server
The Firebug community has implemented many extensions that allow developers to use console.* APIs on the (HTTP) server side, so you can see your backend logs right in the browser. This feature is now natively supported in Firefox and you don’t need to install an additional extension.
All you need to do is enable logs coming from the server inside the Console panel.
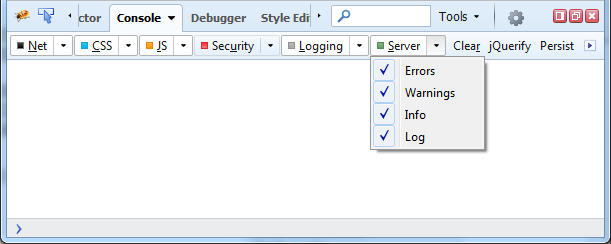
This feature supports an existing protocol (used in Chrome Logger) that sends logs through HTTP headers to the client. Logs are consequently displayed in the Console panel as if they had been generated by JavaScript on the page. There are many server-side libraries that provide the appropriate server side API in various languages (NodeJS, Ruby, Python, PHP, .NET, Java, etc.)
Here is an example of server side logging:
var chromelogger = require('chromelogger');
var http = require('http');
var server = http.createServer();

server.on('request', chromelogger.middleware);
server.on('request', function(req, res) {
  res.chrome.log('Hello from Node.js %s', process.version);
  res.end();
});

server.listen(7357);
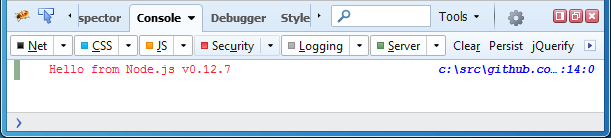
And here is what the server-side log looks like in the Console panel:
Final words
As I mentioned at the beginning of the article, we are trying to unify native Firefox Developer tools (DevTools) and Firebug since we believe that this is an effective strategy for delivering great tools for web developers. There is more yet to come, but this post should give you an overview of our plan and where we are heading. Stay tuned!
Please post feedback in the Firebug group, thanks.
Jan ‘Honza’ Odvarko
About Jan Honza Odvarko
Honza is working on Firefox Developer Tools
7 comments