
This article concerns diagrammatically representing Angular applications. It is a first step, not a fully figured out dissertation about how to visual specify or document Angular apps. And maybe the result of this is that I, with some embarrassment, find out that someone else already has a complete solution.
My interest in this springs from two ongoing projects:
- My day job working on the next generation version of Desk.com‘s support center agent application and
- My night job working on a book, Angular In Depth, for Manning Publications
1: Large, complex Angular application
The first involves working on a large, complex Angular application as part of a multi-person front-end team. One of the problems I, and I assume other team members encounter (hopefully I’m not the only one), is getting familiar enough with different parts of the application so my additions or changes don’t hose it or cause problems down the road.
With Angular application it is sometimes challenging to trace what’s happening where. Directives give you the ability to encapsulate behavior and let you employ that behavior declaratively. That’s great. Until you have nested directives or multiple directives operating in tandem that someone else painstakingly wrote. That person probably had a clear vision of how everything related and worked together. But, when you come to it newly, it can be challenging to trace the pieces and keep them in your head as you begin to add features.
Wouldn’t it be nice to have a visual representation of complex parts of an Angular application? Something that gives you the lay-of-the-land so you can see at a glance what depends on what.
2: The book project
The second item above — the book project — involves trying to write about how Angular works under-the-covers. I think most Angular developers have at one time or another viewed some part of Angular as magical. We’ve also all cursed the documentation, particularly those descriptions that use terms whose descriptions use terms whose descriptions are poorly defined based on an understanding of the first item in the chain.
There’s nothing wrong with using Angular directives or services as demonstrated in online examples or in the documentation or in the starter applications. But it helps us as developers if we also understand what’s happening behind the scenes and why. Knowing how Angular services are created and managed might not be required to write an Angular application, but the ease of writing and the quality can be, I believe, improved by better understanding those kinds of details.
Visual representations
In the course of trying to better understand Angular behind-the-scenes and write about it, I’ve come to rely heavily on visual representations of the key concepts and processes. The visual representations I’ve done aren’t perfect by any means, but just working through how to represent a process in a diagram has a great clarifying effect.
There’s nothing new about visually representing software concepts. UML, process diagrams, even Business Process Modeling Notation (BPMN) are ways to help visualize classes, concepts, relationships and functionality.
And while those diagramming techniques are useful, it seems that at least in the Angular world, we’re missing a full-bodied visual language that is well suited to describe, document or specify Angular applications.
We probably don’t need to reinvent the wheel here — obviously something totally new is not needed — but when I’m tackling a (for me) new area of a complex application, having available a customized visual vocabulary to represent it would help.
Diagrammatically representing front-end JavaScript development
I’m working with Angular daily so I’m thinking specifically about how to represent an Angular application but this may also be an issue within the larger JavaScript community: how to diagrammatically represent front-end JavaScript development in a way allows us to clearly visualize our models, controllers and views, and the interactions between the DOM and our JavaScript code including a event-driven, async callbacks. In other words, a visual domain specific language (DSL) for client-side JavaScript development.
I don’t have a complete answer for that, but in self-defense I started working with some diagrams to roughly represent parts of an Angular application. Here’s sort of the sequence I went through to arrive at a first cut:
- The first thing I did was write out a detailed description of the problem and what I wanted out of an Angular visual DSL. I also defined some simple abbreviations to use to identify the different types of Angular “objects” (directives, controllers, etc.). Then I dove in began diagramming.
- I identified the area of code I needed to understand better, picked a file and threw it on the diagram. What I wanted to do was to diagram it in such a way that I could look at that one file and document it without simultaneously having to trace everything to which it connected.
- When the first item was on the diagram, I went to something on which it depended. For example, starting with a directive this leads to associated views or controllers. I diagrammed the second item and added the relationship.
- I kept adding items and relationships including nested directives and their views and controllers.
- I continued until the picture made sense and I could see the pieces involved in the task I had to complete.
Since I was working on a specific ticket, I knew the problem I needed to solve so not all information had to be included in each visual element. The result is rough and way too verbose, but it did accomplish:
- Showing me the key pieces and how they related, particularly the nested directives.
- Including useful information on where methods or $scope properties lived.
- Giving a guide to the directories where each item lives.
It’s not pretty but here is the result:
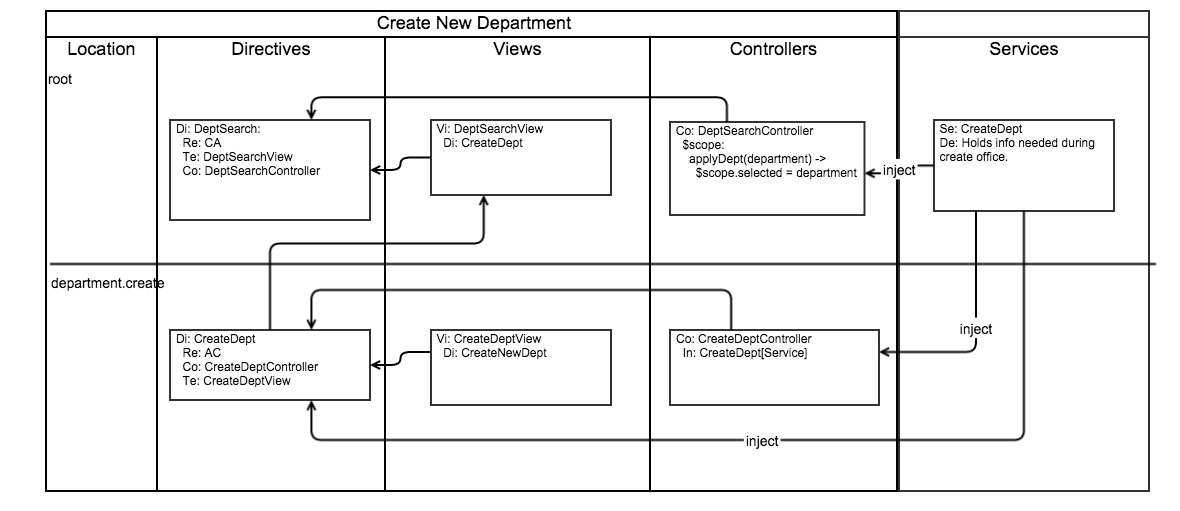
This represents a somewhat complicated part of the code and having the diagram helped in at least four ways:
- By going through the exercise of creating it, I learned the pieces involved in an orderly way — and I didn’t have to try to retain the entire structure in my head as I went.
- I got the high-level view I needed.
- It was very helpful when developing, particularly since the work got interrupted and I had to come back to it a few days later.
- When the work was done, I added it to our internal WIKI to ease future ramp-up in the area.
I think the some next steps might be to define and expand the visual vocabulary by adding things such as:
- Unique shapes or icons to identify directives, controllers, views, etc.
- Standardize how to represent the different kinds of relationships such as ng-include or a view referenced by a directive.
- Standardize how to represent async actions.
- Add representations of the model.
As I said in the beginning, this is rough and nowhere near complete, but it did confirm for me the potential value of having a diagramming convention customized for JavaScript development. And in particular, it validated the need for a robust visual DSL to explore, explain, specify and document Angular applications.
About David Aden
I have worked for more than 20 years in high tech, most of that time on web-related projects. Currently, I'm co-authoring Manning Publication's "AngularJS in Depth" (http://www.manning.com/aden/) which more than keeps me busy off-hours. During the day, I'm working at Salesforce on the next generation Angular version of Desk.com's support agent.
About Robert Nyman [Editor emeritus]
Technical Evangelist & Editor of Mozilla Hacks. Gives talks & blogs about HTML5, JavaScript & the Open Web. Robert is a strong believer in HTML5 and the Open Web and has been working since 1999 with Front End development for the web - in Sweden and in New York City. He regularly also blogs at http://robertnyman.com and loves to travel and meet people.
4 comments