Toolbox, Inspector & Scratchpad improvements – Firefox Developer Tools Episode 32

Firefox 32 was just uplifted to the Aurora release channel, so let’s take a look at the most important Developer Tools changes in this release.

First, we would like to thank all 41 people who contributed patches to DevTools this release! Here is a list of all DevTools bugs resolved for Firefox 32.

Toolbox

We’ll start out the list with a couple of features that were requested on the new UserVoice feedback channel that we are trying out.

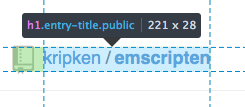
Node dimensions are now displayed in the box model infobar. Similar to how other tools work, you can easily refer to the dimensions of the highlighted node directly from the infobar. (development notes & UserVoice request)

Screenshot of node dimensions being shown in the infobar above the box model highlighter

The ‘pick an element from the page’ button is now closer to the inspector tab so it is quicker to jump between them. Protip: you can also use the Ctrl+Shift+C or Cmd+Opt+C keyboard shortcuts to do the same thing. (development notes & UserVoice request)

Screenshot of the new Inspect Element position on the left side of the toolbox

There is now a ‘full page screenshot’ command button. After enabling this button, just press it and a screenshot will appear in your downloads folder. (development notes)

Screenshot of taking a screenshot of the current page with DevTools

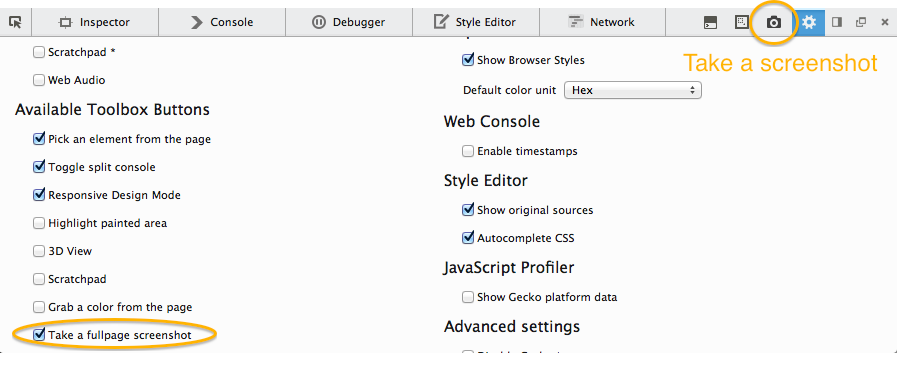
A demonstration of the screenshot can be seen in the animated gif below:

Animated gif of taking a screenshot of the current page with DevTools

New images are being used throughout the DevTools UI to support high pixel density displays (HiDPI), so the UI looks much sharper on these devices. Big thanks to our contributor Tim Nguyen for his hard work on these changes! (development notes)

Web Audio Editor

Joining the Shader Editor and Canvas Debugger, the Web Audio Editor is a new media tool that has landed in Firefox 32. After enabling it in the options panel, you can inspect the AudioContext graph and modify properties on AudioNodes. Check out the Introducing the Web Audio Editor hacks post for much more information about this tool.

Screenshot of the new web audio tool

Inspector

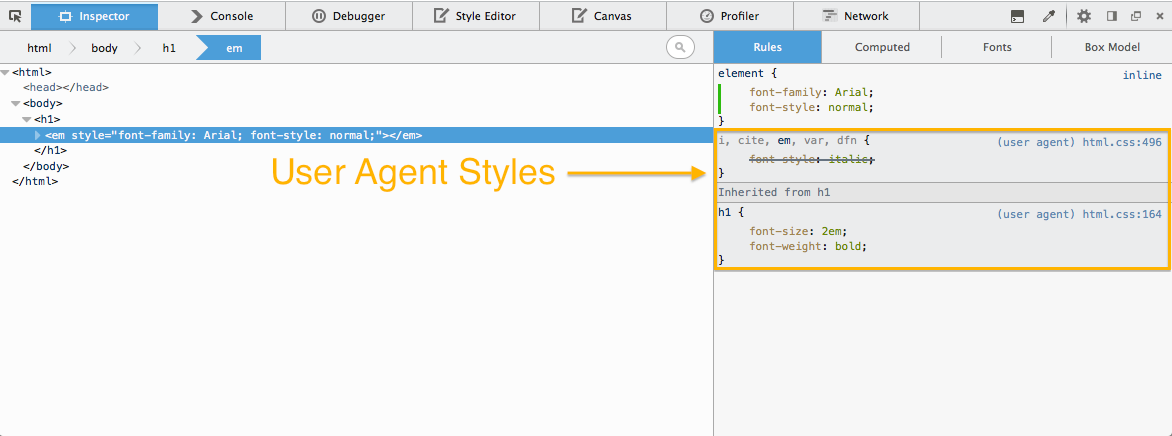
User agent styles can be shown in the Inspector. Since these default styles can interact with your page styles, it is handy to see them. This can be enabled from the options panel, and there is more documentation about this feature on MDN. (development notes & UserVoice request)

Screenshot of viewing user agent styles in the Inspector Panel

Animated gif of viewing user agent styles in the Inspector Panel

Hidden nodes are now displayed differently from visible nodes in the markup view. (development notes & UserVoice request)

Screenshot of hidden nodes being displayed differently in the Inspector panel

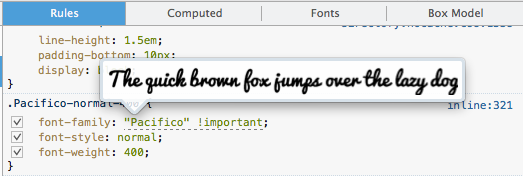
Web fonts are previewable within the font inspector tooltip. When hovering a font stack, you will see the currently applied font in the tooltip (including any web fonts). (development notes)

Screenshot of a web font being previewed in the Inspector panel

There is now a ‘Paste Outer HTML’ context menu entry for nodes in the markup view. (development notes & UserVoice request)

Scratchpad

There is now type-inference based code completion for JavaScript in Scratchpad. Open a list of suggestions at your current cursor position with Ctrl+Space and type information about the current symbol can be shown with Shift+Space. It is being powered by the excellent tern code-analysis engine. (development notes)

Screenshot of scratchpad showing an autocompletion list

Screenshot of scratchpad showing type information about a function

Do you have feedback, bug reports, feature requests, or questions? As always, you can comment here, add/vote for ideas on UserVoice or get in touch with the team at @FirefoxDevTools on Twitter.

About Brian Grinstead

More articles by Brian Grinstead…

About Robert Nyman [Editor emeritus]

Technical Evangelist & Editor of Mozilla Hacks. Gives talks & blogs about HTML5, JavaScript & the Open Web. Robert is a strong believer in HTML5 and the Open Web and has been working since 1999 with Front End development for the web - in Sweden and in New York City. He regularly also blogs at http://robertnyman.com and loves to travel and meet people.

More articles by Robert Nyman [Editor emeritus]…


17 comments

  1. Mindaugas

    Regarding CSS in inspector:
    https://bugzilla.mozilla.org/show_bug.cgi?id=920665 still needs love

    June 17th, 2014 at 08:49

    1. Brian Grinstead

      You should be able to see these styles in the Inspector now if you enable user agent styles. That bug report has to do with the Style Editor, which still doesn’t show user agent / addon injected CSS. I’ll comment on the bug with some steps for doing that.

      June 17th, 2014 at 09:03

      1. Mindaugas

        Indeed I can see them with browser styles enabled. Thanks

        June 17th, 2014 at 09:05

  2. Skoua

    I won’t have to repeat for the 94340984th time to my girlfriend “shift-f2-screenshot-name-of-your-file-dash-dash-fullpage” anymore, thanks!

    June 17th, 2014 at 08:58

    1. Jeff Griffiths

      Hah, nice :)

      June 17th, 2014 at 11:34

  3. neeks

    I tried to switch from chrome to firefox as my daily driver a month ago; however without the node dimensions it was impossible.

    If you could just implement adding styles on the fly to a highlighted node, I would make the switch.

    June 17th, 2014 at 09:28

    1. Brian Grinstead

      I think you are referring to adding new selectors in the css rule view – luckily this bug is assigned and being worked on :) https://bugzilla.mozilla.org/show_bug.cgi?id=966896. You could also always flip over to the Style Editor to do this, but it will obviously be handy to do this right inline in the inspector.

      June 17th, 2014 at 09:33

    2. Luke

      You can add styles to highlighted node – at the top, where it shows:

      element {

      }

      Just click between and add styles.
      You can also add any number of new css rules, from the style editor tab.

      I wrote an extension, “Devtools Tweaks”, awhile ago that gives right click – new rule in the rules tab (basically just a shortcut)

      June 18th, 2014 at 19:05

  4. Mindaugas

    sourceURL= comment support in Debugger/Style Editor/Inspector

    JS:
    https://bugzilla.mozilla.org/show_bug.cgi?id=833744

    CSS (duplicates):
    https://bugzilla.mozilla.org/show_bug.cgi?id=880831
    https://bugzilla.mozilla.org/show_bug.cgi?id=880790

    June 17th, 2014 at 09:44

  5. ScampDoodle

    Any chance of providing a tool to inspect the context of a Knockout ViewModel? It’s the one thing I switch to Chrome for, but I much prefer the Firefox browser/suite of dev tools.

    June 17th, 2014 at 15:04

    1. Brian Grinstead

      I don’t know of any extensions doing that yet, but I know that the Ember Inspector project had success in converting a Chrome DevTools addon into a cross browser addon that targets Firefox DevTools as well: https://hacks.mozilla.org/2013/12/ember-inspector-on-a-firefox-near-you-2/. We have also been working on some addon SDKs to make this type of thing easier. So I think there is hope you will see this, but someone will have to build (or port) an extension.

      June 18th, 2014 at 05:28

  6. Junior

    Hi, I’ve doing a list a since I left Firebug and got FDT to use everyday (I’m not able to access https now, so I can’t post on bugzilla):
    (My FF version is 30b9, so I don’t know it is already implemented on ‘newer versions’…

    – Resize columns in Network guide:
    == > When you hover links (let we say: from an ajax request) on Firebug, the url is “highlighted”… I think a better approach on FDT is just allow resize columns (Method, File, Domain) on network tab;

    – Select an element and delete it;
    ==> On Firebug I’m able to select an element on page and simple delete it pressing DEL. On FDT when I select an element (with Inspector tag opened) the source code (in Inspector tab) has not the focus, so I should focus it and then delete the element;

    – Search inside files;
    ==> Recently I found out the tricks to find inside JS files… I don’t know it’s possible to do it in Inspector tab (HTML source)… I can only search for tags over there… I tried “!expression”, like I do in Debugger tab, but it doesn’t work (Firebug does it)…
    Similar to CSS, that apparently only allows search in current file (I would like search in all files)…

    – Properties: combobox style (but with scrollbars):
    ==> Some properties (i.e.: position) have ‘autocompletion’… I think it’s cool, but sometimes (i.e.: list-style-type) not every value possible is showed…
    Would be cool something like a combo with scrollbars (in Rules, inside Inspector tab). When we type “align”, a combo with values ‘absolute, relative, etc…’

    Similar, when we type something like ‘border’, it’s showed options from ‘border’ until ‘border-images’ (Not all properties are showed… It would be better a scrollbar with all properties ‘available’)….

    June 18th, 2014 at 05:22

  7. Junior

    Ha, I forgot something:
    A feature ‘reset settings’ (like Firebug) would be cool too… Recently I screwed up my settings and Network tab was not working anymore, I don’t know why…

    I had to clear settings manually (via about:config -> search for devtools and set all to default value)…

    June 18th, 2014 at 05:25

    1. Robert Nyman [Editor]

      Thanks for the feedback! As mentioned in the post, please add your feedback at the feedback channel at UserVoice.

      June 18th, 2014 at 10:29

  8. Eduardo

    We want a colorpicker for the styles editor (as Chrome does)

    June 21st, 2014 at 09:07

  9. Sebastian

    Oh come on! The developer tools are useless if you can not add custom style rules. Just pseudo selectors are absolutely necessary! In Chrome it all has long been implemented.

    June 27th, 2014 at 00:43

    1. Brian Grinstead

      You can already add custom rules in the Style Editor, but support for this in the Inspector is being worked on here: https://bugzilla.mozilla.org/show_bug.cgi?id=966895.

      June 27th, 2014 at 05:29

Comments are closed for this article.