
The Canvas Debugger is a new tool we’ll be demoing at the Game Developers Conference in San Francisco. It’s a tool for debugging animation frames rendered on a Canvas element. Whether you’re creating a visualization, animation or debugging a game, this tool will help you understand and optimize your animation loop. It will let you debug either a WebGL or 2D Canvas context.
You can debug an animation using a traditional debugger, like our own JavaScript Debugger in Firefox’ Developer Tools. However, this can be difficult as it becomes a manual search for all of the various canvas methods you may wish to step through. The Canvas Debugger is designed to let you view the rendering calls from the perspective of the animation loop itself, giving you a much better overview of what’s happening.
How it works
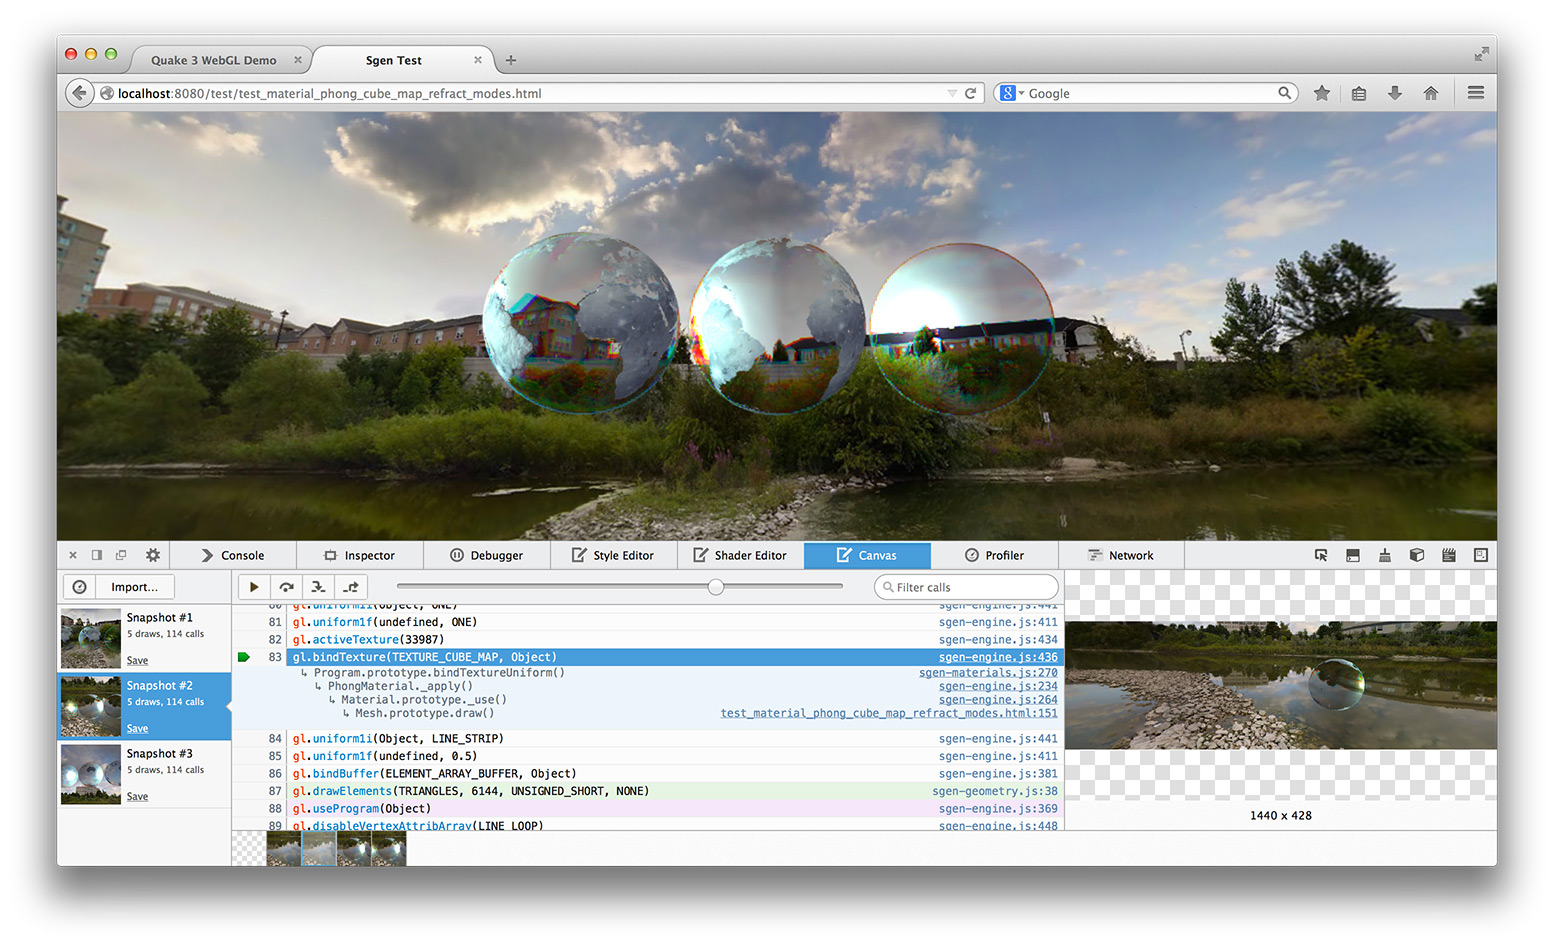
The Canvas Debugger works by creating a snapshot of everything that happens while rendering a frame. It records all canvas context method calls. Each frame snapshot contains a list of context method calls and the associated JavaScript stack. By inspecting this stack, a developer can trace the call back to the higher level function invoked by the app or engine that caused something to be drawn.
Certain types of Canvas context functions are highlighted to make them easier to spot in the snapshot. Quickly scrolling through the list, a developer can easily spot draw calls or redundant operations.

Each draw call has an associated screenshot arranged in a timeline at the bottom of the screen as a “film-strip” view. You can “scrub” through this film-strip using a slider to quickly locate a draw call associated with a particular bit of rendering. You can also click a thumbnail to be taken directly to the associated draw call in the animation frame snapshot.

The thumbnail film-strip gives you get a quick overview of the drawing process. You can easily see how the scene is composed to get the final rendering.
Stepping Around
You might notice a familiar row of buttons in the attached screenshot. They’ve been borrowed from the JavaScript Debugger and provide the developer a means to navigate through the animation snapshot. These buttons may change their icons at final release, but for now, we’ll describe them as they currently look.
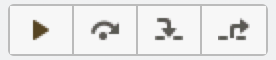
- “Resume” – Jump to the next draw call.
- “Step Over” – Goes over the current context call.
- “Step Out” – Jumps out of the animation frame (typically to the next requestAnimationFrame call).
- “Step In” – Goes to the next non-context call in the JavaScript debugger
Jumping to the JavaScript debugger by “stepping in” on a snapshot function call, or via a function’s stack, allows you to add a breakpoint and instantly pause if the animation is still running. Much convenience!
Future Work
We’re not done. We have some enhancements to make this tool even better.
- Add the ability to inspect the context’s state at each method call. Highlight the differences in state between calls.
- Measure Time spent in each draw call. This will readily show expensive canvas operations.
- Make it easier to know which programs and shaders are currently in use at each draw call, allowing you to jump to the Shader Editor and tinkering with shaders in real time. Better linkage to the Shader Editor in general.
- Inspecting Hit Regions by either drawing individual regions separately, colored differently by id, or showing the hit region id of a pixel when hovering over the preview panel using the mouse.
And we’re just getting started. The Canvas Debugger should be landing in Firefox Nightly any day now. Watch this space for news of its landing and more updates.
About Victor Porof
Mozillian, hacker, working on Firefox DevTools.
9 comments