Firefox Developer Tool Features for Firefox 23

Another uplift has left the building and it’s time to take a look at what’s in Firefox Developer Tools in Firefox 23 currently Aurora, our pre-beta channel. You can download it from the Aurora Download page today. Firefox 23 is currently scheduled to hit the release channel on Tuesday August 6th, 2013.

Episode XXIII is a barn-storming, hair-raising spectacle of incredible epicness that is sure to delight and amuse. If you want a sneak peak at features under active development, give Nightly a try.
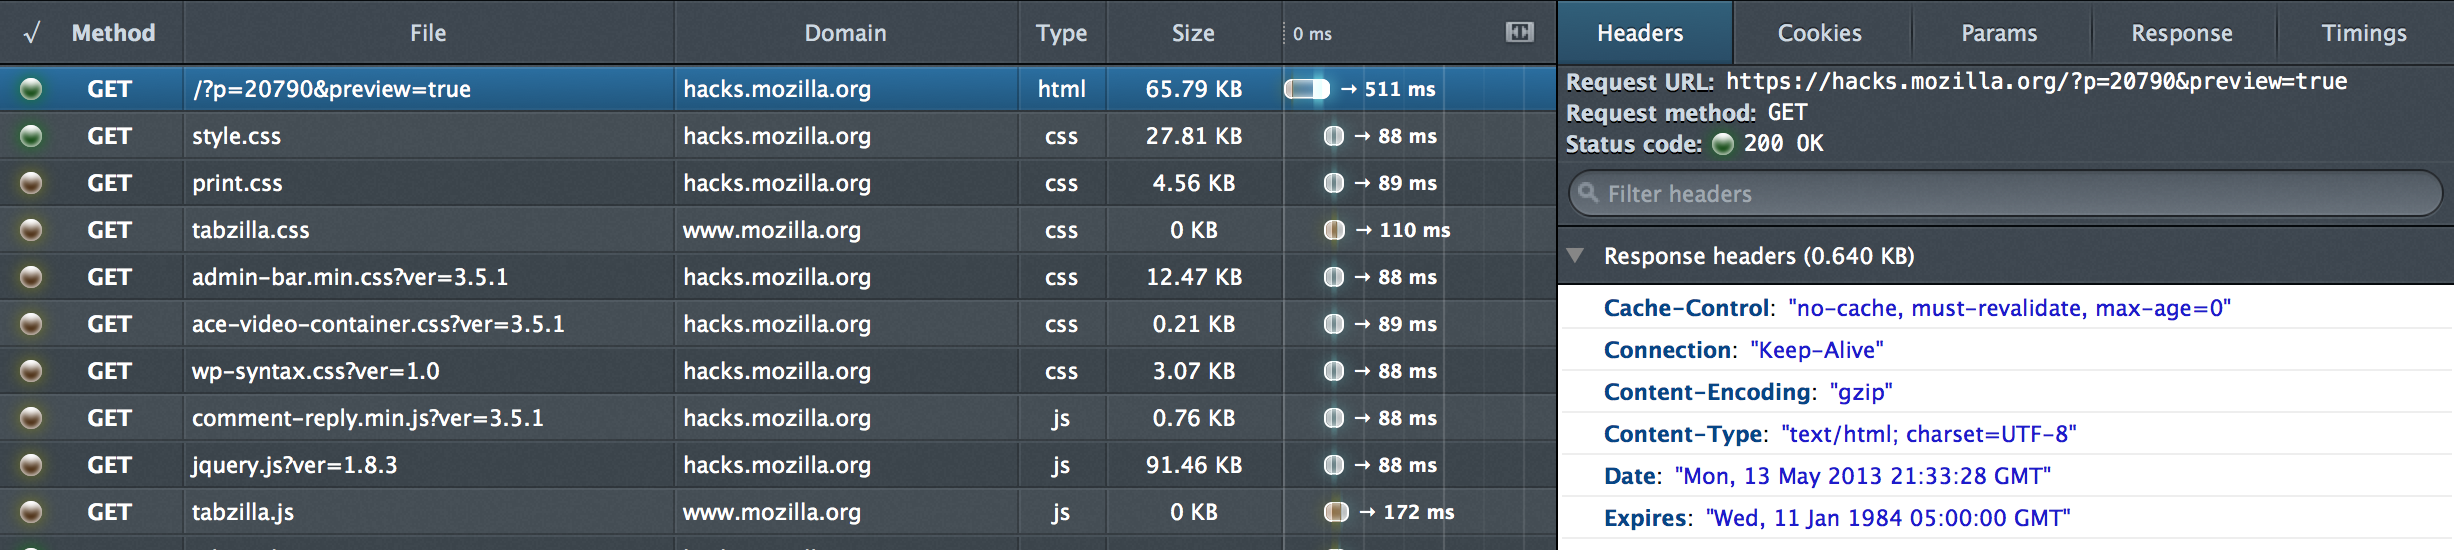
Network Monitor

There’s a new tool in the toolbox: The Network Monitor. It’s a classic waterfall timeline view of network activity on a site. This data’s been available since Firefox 4 via the Web Console, albeit in a less visually pleasing way.

Please file bugs under the Developer Tools: Netmonitor component in Bugzilla.

Remote Style Editor

In Firefox 23, you can now edit styles via a Remote Connection on a suitably-enabled device. This should be great help for App Developers interested in testing and debugging styles on a mobile device over the remote protocol in real time.

As of the time of this writing, the Remote Style Editor should be compatible with Firefox for Android version 23, also scheduled for uplift to Aurora. We are working on incorporating the Style Editor Actors for the remote protocol into the Firefox OS Simulator and investigating what it will take to backport them to Firefox OS release.

Options Panel

We’ve added a Gear menu to the Toolbar containing an Options panel for turning tools on or off. As we add more stuff, this is going to be a popular place to manage preferences related to the Developer Tools.

Currently, there are options to turn on the Light or Dark theme for the tools and enable Chrome Debugging.

Initial SourceMap Support for Debugger Protocol

The first pieces of SourceMap support for the Debugger have landed and we are now able to serve up SourceMapped JS files for your debugging pleasure. Soon to follow will be column support for breakpoints allowing you to debug minified JS with a SourceMap.

Watch for the upcoming blog post by Nick Fitzgerald on Hacks explaining the magic.

Variables View Everywhere

Our Variables View is an improved Object Inspector and an integral part of our Debugger. Naturally, we wanted to put it in Everything. So now the Web Console and Scratchpad have a Variables View. Use the ESC key to close it.

Browser Console

If you have Chrome Debugging turned on, check out the Browser Console. It’s a replacement for the ancient Error Console and gives you a Chrome-context command line for executing JavaScript against the browser. It’s nice and should be enabled by default in Firefox 24.

GCLI Appcache Command

We finally have a little something for developers trying to use App Cache to store offline data. A new appcache command for the Graphical Command Line. You can read about it in Mike Ratcliffe’s The Application Cache is no longer a Douchebag.

Web Console in Debugger Frame

The Web Console is now fully-remoted (and has been since version 18). It now makes use of the Debugger’s current Frame if paused on a breakpoint.

Multiple Paused Debuggers

You can now debug multiple tabs at the same time using the Script Debugger. Previously, when attempting to use the debugger on two separate tabs, you’d be given a notification to resume the debugger in the other tab. Now you can debug as many tabs as you like.

There is one caveat to this awesome power, however. Due to the nested event loops each Debugger creates, you have to resume each tab in the order in which they were paused. Debug carefully and always carry a big stack.

You can see a comprehensive list of bugfixes in table form in Firefox 23 Developer Tools Fixes.

About Robert Nyman [Editor emeritus]

Technical Evangelist & Editor of Mozilla Hacks. Gives talks & blogs about HTML5, JavaScript & the Open Web. Robert is a strong believer in HTML5 and the Open Web and has been working since 1999 with Front End development for the web - in Sweden and in New York City. He regularly also blogs at http://robertnyman.com and loves to travel and meet people.

More articles by Robert Nyman [Editor emeritus]…


24 comments

  1. Ron

    Will multiple paused debuggers work without that caveat in 24?

    May 21st, 2013 at 02:54

    1. Rob Campbell

      Hi Ron, until Firefox has true multi-process tabs, this will be a requirement for pausing more than one tab at a time.

      May 21st, 2013 at 04:41

  2. André

    Don’t know if its still my (linux) setup, but using the dev tools in firefox is sooo sluggish and slow compared to chrome Even on a fairly decent machine. This always brings me back to chrome when it comes to debugging :(

    May 21st, 2013 at 03:08

    1. Skatox

      I use linux (archlinux) and i don’t see any delay with Fx Developers tools

      May 21st, 2013 at 06:29

    2. Daniel

      Dev tools are slightly slow only on Windows for me at times. On my Xubuntu, Firefox dev tools fly like any other app.

      May 21st, 2013 at 06:51

  3. eric

    i hope that one day i’ll be able to remove firebug and use just the dev tools

    May 21st, 2013 at 05:56

    1. Luke

      What features are missing from Firefox dev tools?

      June 10th, 2013 at 23:37

  4. Skatox

    Nice! This were the missing features that kept me using Firebug, now i can use the Fx developers tools :)

    May 21st, 2013 at 06:29

  5. leeoniya

    Is there any way to disable console persistence between page refreshes? The auto-persistence drives me nuts. Also is multi-line console in the pipeline?

    thanks!

    May 21st, 2013 at 08:22

  6. Doug

    Nice! Finally we have something to beat Chrome developer tool!
    Hey, in the network tab, is there a way to clear the connections to the clean state?
    Thanks

    May 21st, 2013 at 10:52

    1. Rahly

      Yes, That’s my only beef with the network monitor. Makes it easier to work with a heavy ajax site, to be able to clear it. Another thing, I thought these tools were never suppose to replace firebug, but it seems that it is increasingly adding more FB features making it more or less obsolete.

      June 19th, 2013 at 15:49

  7. Thomas Andersen

    Thanks for doing a great job!
    and my questions ;)

    1. Pardon my impatience, but how do we use source maps? I see there is a config property named “devtools.debugger.source-maps-enabled” which is default set to false. When setting it to true I can not see anything different in the Debugger tab. Am I missing something

    2. Are there any estimate on when the dev tools api will be ready?
    Based on this: https://developer.mozilla.org/en-US/docs/Tools/DevToolsAPI and https://github.com/mozilla/mozilla-central/tree/master/browser/devtools/framework/test I have been able to create a simple extension and would love some more info

    Thanks,
    Thomas

    May 21st, 2013 at 11:55

    1. Rob Campbell

      Hi Thomas,

      First, expect a blog post very soon about how to use Source Maps. As I mentioned in the article, this is “initial support” and we’ll be landing more capabilities over the next little while. Ultimately, we’ll be able to present and debug minified JS within the debugger given a source map (maybe even without one!).

      We’re using the DevTools API right now internally and it’s reasonably stable. We are however doing some work to add in a loader that will give us the ability to do some things more dynamically. Like reload the devtools from a running instance of Firefox. I’d recommend waiting for the next release before basing any addons on the current API.

      I’d also like to ship a proper Addon SDK Module for the Devtools at some point as well.

      thanks for the comment!

      May 21st, 2013 at 17:42

      1. Luke

        By using source-map do you only mean ability to step through un-mini-fied code? Or do you mean the ability to highlight element from the debugger, instead of only seeing the variable’s attributes? I’ve been working on an extension to add some features I missed in devtools (https://github.com/programmin1/DevTools-Tweaks), but that is one feature I really miss, that I have not been able to add. I did some research, and it seems very possible (http://stackoverflow.com/questions/17120754), I’m curious if this could come in 23 or 24?

        June 19th, 2013 at 19:52

  8. Aras

    Very cool! I am so excited about remote style editor and improvements to console. I am currently running Aurora 22 in Ubuntu, so you know if there is a simple way to upgrade to Aurora 23? Is there a reliable PPA somewhere?

    May 21st, 2013 at 20:24

  9. Christopher Shankland

    Hi Rob,

    I’m wondering if there’s plans for WebSocket aware network tools in the future? Or perhaps I’m just using the current ones wrong?

    Cheers

    May 22nd, 2013 at 05:52

    1. Rob Campbell

      yes. :)

      May 22nd, 2013 at 06:34

  10. Gaurav

    https://launchpad.net/~ubuntu-mozilla-daily/+archive/ppa

    May 22nd, 2013 at 05:59

  11. Oğuz Çelikdemir

    I don’t know anybody tried to debug an ExtJS app ( as you might guess, more or less 1 mb minified javascript library, expecially for enterprise customers ) in Firefox. The debug performance realy bad compared to Chrome. Worst thing is any breakpoint crashing the browser!

    Another thing is, why we should use third party extensions to be able do somethings like auto refresh while we are working on a project? I believe that Firefox dev team can implement such a things.

    May 22nd, 2013 at 11:21

  12. piotr_cz

    Good job guys, I’m impressed.
    I’m really happy to see how Firefox is doing.

    Is there any way to move debugbar to right side of the window or to a separate window? This really helps on widescreen and 2 screen systems.

    May 24th, 2013 at 00:46

    1. Rob Campbell

      Hi Piotr,

      In the upper left corner of the Toolbox, there are the Dock Icons. The one with the vertical bar in it is for docking on the right. The one with the two squares is for separate window mode.

      see: screenshot.

      Not all of our tools work great in the sidebar, we need to reorganize the Debugger a bit to work well there, but it should be usable at least.

      Thanks for the comment!

      May 24th, 2013 at 03:42

  13. Mathew Porter

    The remote style editor sounds like a great feature, I will have to check this out later.

    May 24th, 2013 at 15:28

  14. Usef

    It’s great to see how rapidly the developer tools are progressing.

    The primary thing I’d like to see are more features for design work: especially color adjustment.

    Currently it’s difficult to make any color adjustments in the inspector for non-trivial properties (such as linear gradients) as there’s a tiny text box you have to arrow through to get to the color value. You have to arrow-through it repeatedly as the cursor position is reset every time you edit it.

    It would be fantastic to have a color picker to quickly make color adjustments (like the Chrome dev tools) with the ability to tweak using useful adjustments (HSL/HSB, unlike the Chrome dev tools).

    I’d also like the ability to display colors using hex code syntax rather than rgb(x, y, z) as I can’t copy and paste the result back into my style sheet easily.

    Regardless, thanks for the great work.

    June 6th, 2013 at 23:35

  15. Usef

    To clarify: A color picker with HSL could let you, for example, decrease the saturation, but still save the result as an rgb/hex color in the stylesheet.

    June 6th, 2013 at 23:40

Comments are closed for this article.